- WTI registers a three-day winning streak.
- A confluence of 100 and 200-day SMAs becomes the key upside barrier.
- Bears will look for entry below $50.00.
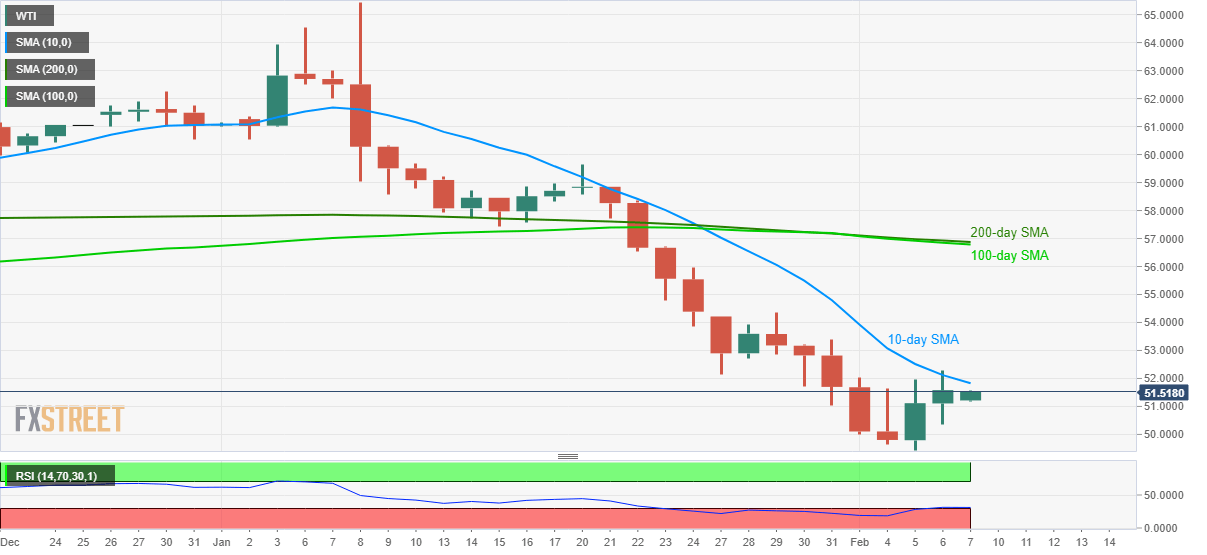
WTI takes the bids to $51.52 during Friday’s Asian session. The energy benchmark continues its previous two-day rise amid oversold RSI conditions.
Even so, 10-day SMA, near $51.83 now, limits the black gold’s immediate upside, a break of which could escalate the current recovery towards January 29 top of $54.37.
However, a confluence of 100 and 200-day SMA near $56.78/88 will challenge the quote’s rise above $54.37.
Meanwhile, the $50.00 round-figure might work as a trigger for selling. Should prices break below the said psychological mark, which is less likely considering oversold RSI, the monthly low surrounding $49.40 will return to the chart.
In a case where the bears dominate beneath $49.40, chances of witnessing a plunge towards late-December 2018 top surrounding $47.00 can’t be ruled out.
WTI daily chart
Trend: Further recovery expected
