- WTI probes $38.00 in an up-move to fill the key gap on the north.
- Sustained trading beyond 100-day SMA, 50% Fibonacci retracement keeps buyers hopeful amid bullish MACD.
- Overbought RSI conditions highlight the five-week-old support line as additional rest-point.
WTI gains over 2.0% while taking the bids near $37.77 during the early Wednesday. In doing so, the black gold crosses the March 11 top of $36.64 while refreshing the three-month high.
Additionally, the energy benchmark stays positive above 100-day SMA and 50% Fibonacci retracement level of January-April fall amid bullish MACD.
Against this backdrop, the oil prices are rising towards filling the gap between March 06 low of $41.22 and March 11 top of $36.64.
However, overbought RSI conditions raise doubts on the quote’s further upside and hence any pullback below $36.40, comprising 100-day SMA, could drag it to a short-term rising support line, at $35.00 now.
In a case where the WTI drops below $35.00, April month high of $32.20 could lure the sellers.
WTI daily chart
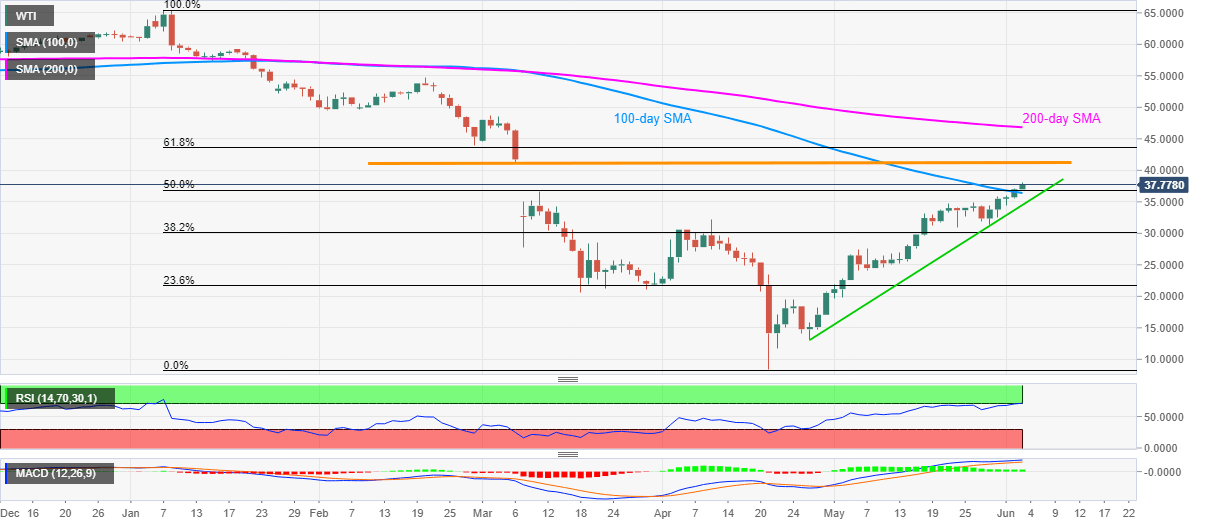
Trend: Bullish
