- WTI refrains from entertaining pullback from a five-month high.
- Sustained trading beyond 50-day SMA, MACD/RSI conditions signal further room to the north.
- June month’s top offers immediate support, February’s low can please buyers.
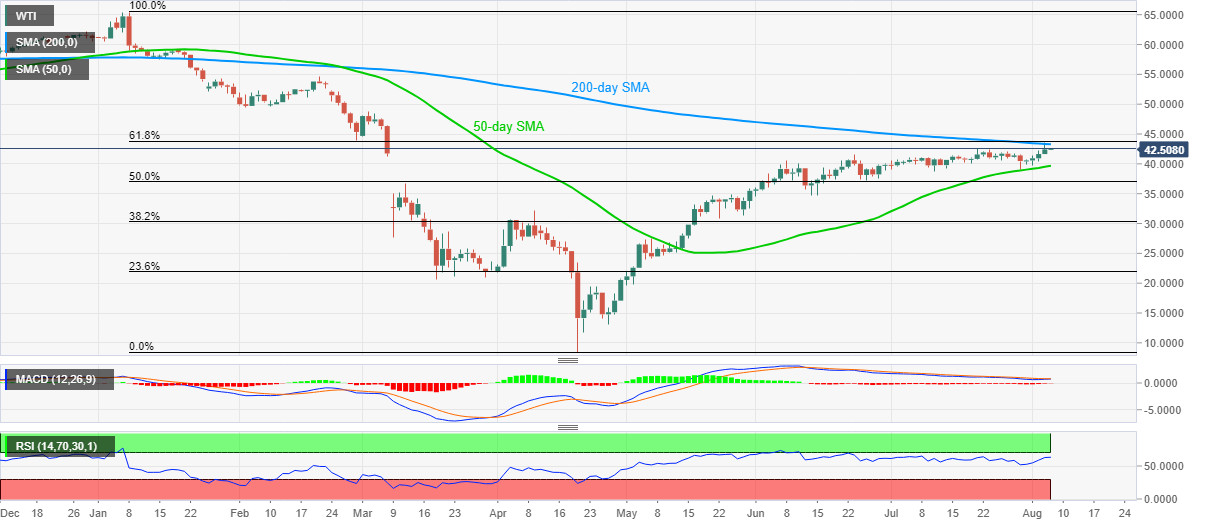
WTI picks up bids near $42.50 during the early Thursday morning in Asia. The energy benchmark surged to the highest since early March the previous day but failed to cross 200-day SMA and 61.8% Fibonacci retracement level of January-April downside.
Even so, oil buyers are cheering the successful trading beyond 50-day SMA while MACD is flirting with the bulls and RSI is yet to visit the overbought region. All these catalysts favor the black gold’s further upside. Though, a clear break above $43.75, comprising the aforementioned Fibonacci retracement becomes the key.
It should be noted that $43.00 and $43.27 comprising 200-day SMA can offer immediate resistance to the quote.
In a case where the energy benchmark manages to conquer $43.75, February month’s low near $44.00 holds the key to the further upside towards March 03 top near $48.75.
Alternatively, June month’s top of $41.64 can entertain sellers during the pullback ahead of $40.00 and 50-day SMA level near $39.70. If at all the bears dominate past-$39.70, 50% Fibonacci retracement level of $37.10 will be in focus.
WTI daily chart
Trend: Bullish
