- WTI keeps the U-turn from Thursday’s low of $37.17.
- $40.00, 200-day EMA are on the bulls’ radars.
- 61.8% Fibonacci retracement adds strength to the nearby support.
- Bearish MACD probes buyers below the early-March low.
WTI eases from the intraday top of $39.26 to $39.15, still up 0.18% on a day, amid the initial Asian session on Friday. The black gold’s recent upside could be traced to its bounce from 21-day EMA.
Considering the energy benchmark’s earlier pullback from the short-term EMA, the quote is likely to remain firm. In doing so, a $40.00 threshold could be immediate resistance ahead of June 08 top near $40.60.
During the quote’s rise past-$40.60, the monthly near $41.65 and 200-day EMA around $42.00 could entertain the buyers. Though, bearish signals from the MACD questions further upside past-$42.00, which if ignored could recall February month low of $43.95 on the charts.
Meanwhile, 61.8% Fibonacci retracement of February-April downside, around $37.00, offers an extra challenge to the sellers below the 21-day EMA level of $37.38.
In a case where the oil prices decline below $37.00, the monthly low around $34.45 will lure the bears before highlighting a 50% Fibonacci retracement level near $31.55.
WTI daily chart
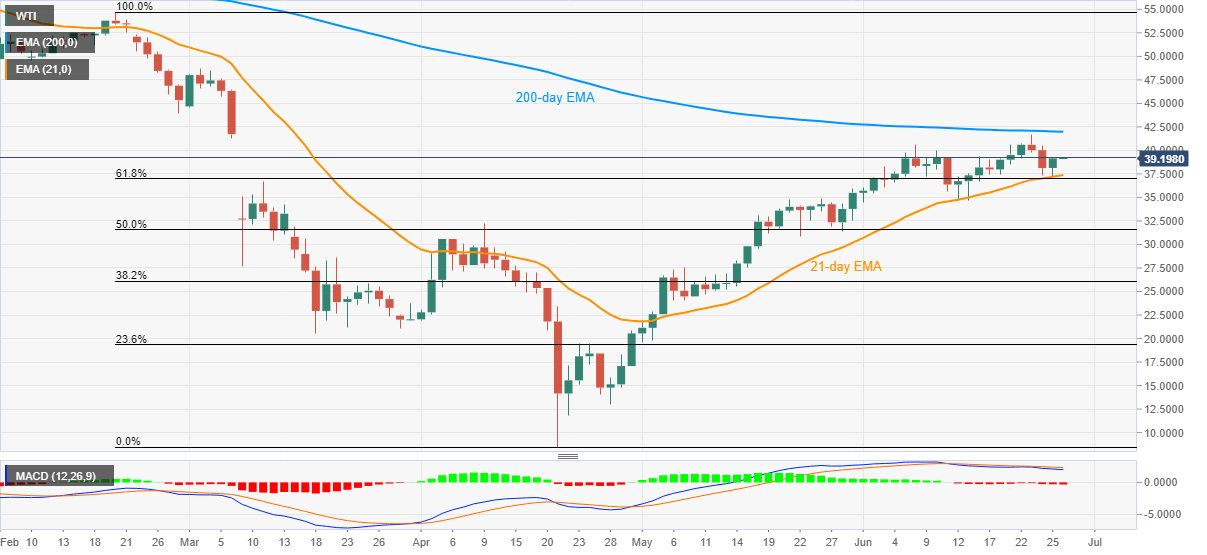
Trend: Further recovery expected
