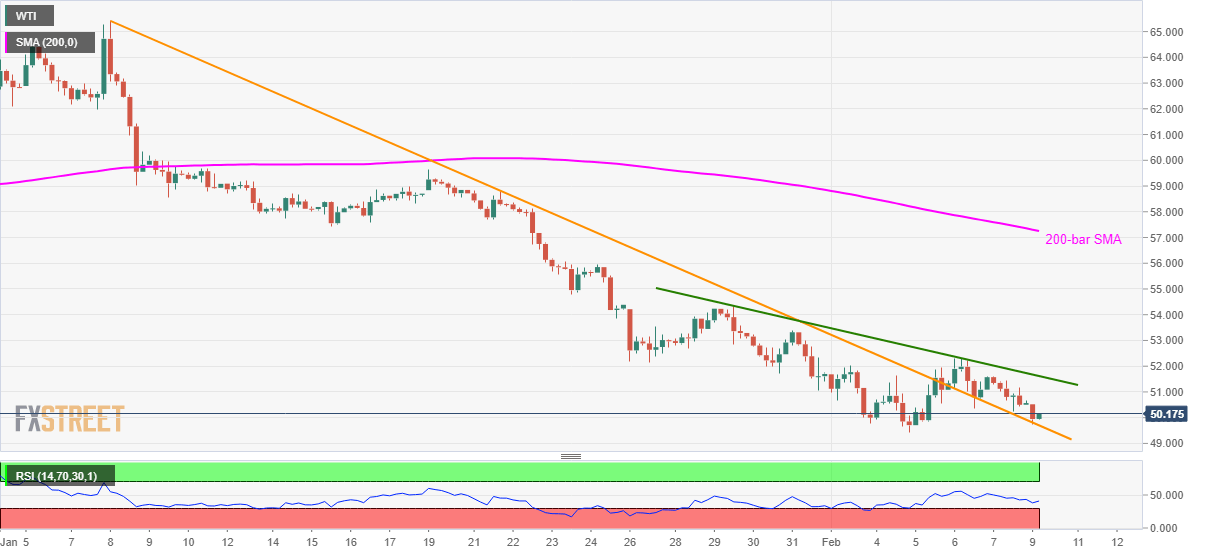
- WTI remains on the back foot between monthly support line, eight-day-old resistance trend line.
- 200-bar SMA, mid-January low act as the key upside barrier.
- The further downside can recall 2018 lows.
WTI seesaws around $50.10 during the early trading hours of Monday. The energy benchmark recently bounced off a descending trend line stretched from January 08. However, a short-term falling resistance line is yet to crossed to justify the pullback.
Not only the falling resistance line since January 29, currently at $51.60, but January 15 low and 200-day SMA confluence around $57.25/45 will also be the key upside barrier for the bulls.
In between $51.60 and $57.45, the high of January 24 near $56.00 can please the buyers.
Alternatively, the black gold’s declines below the resistance-turned-support, at $49.70, might avail a chance to bounce off the latest lows near $49.40.
Should oil prices slip below $49.40, December 26, 2018 top near $47.00 can entertain the bears ahead of the year 2018 low surrounding $42.50.
WTI four-hour chart
Trend: Bearish
