- WTI bears target the monthly W-formations neckline.
- The 4-hour chart’s support structure has been broken and retested.
WTI is ripe from a short side perspective as it consolidates at long term resistance following a W-formation on the monthly chart and targets the neckline of the formation to the downside as follows:
Monthly chart
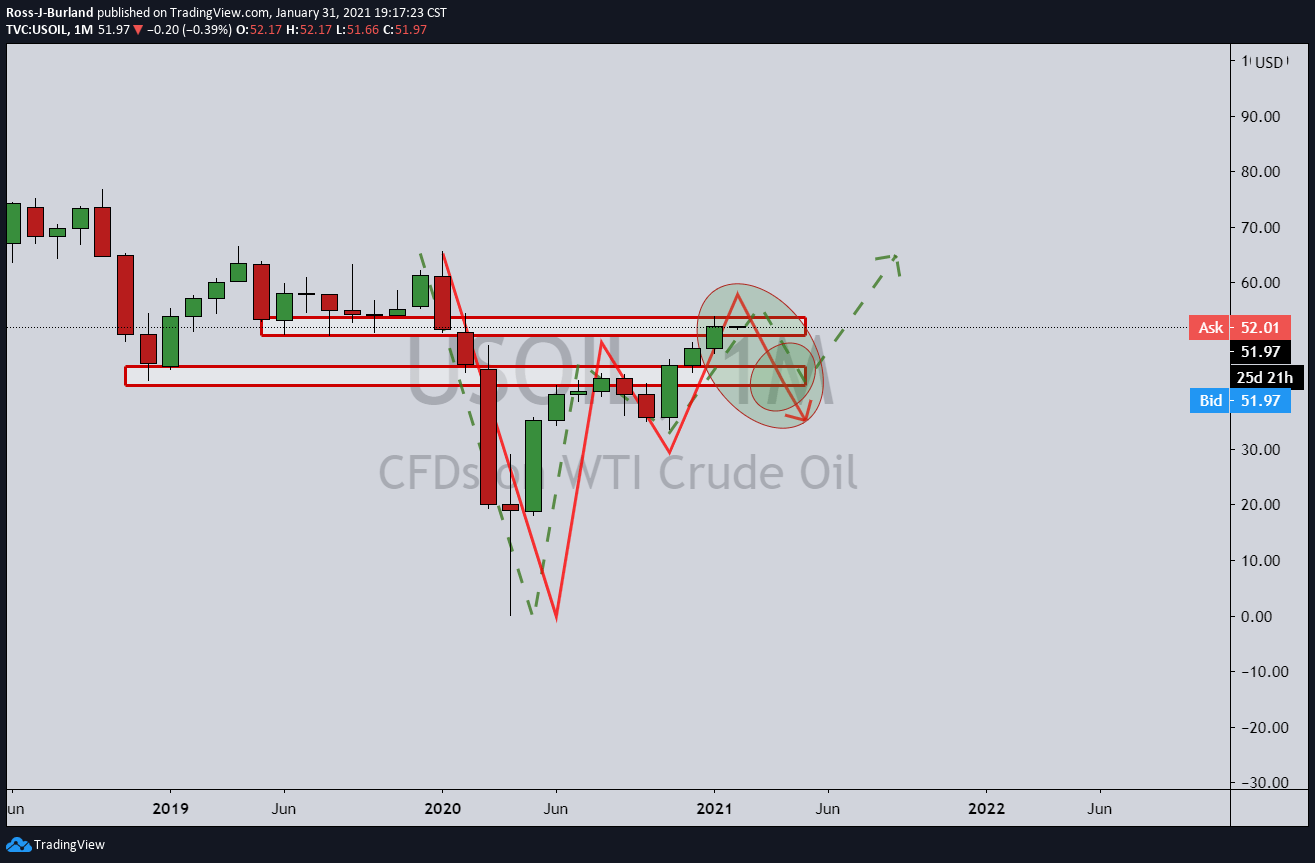
The following is a top-down analysis that tracks the time frames and arrives a selling opportunity and set-up:
Weekly chart
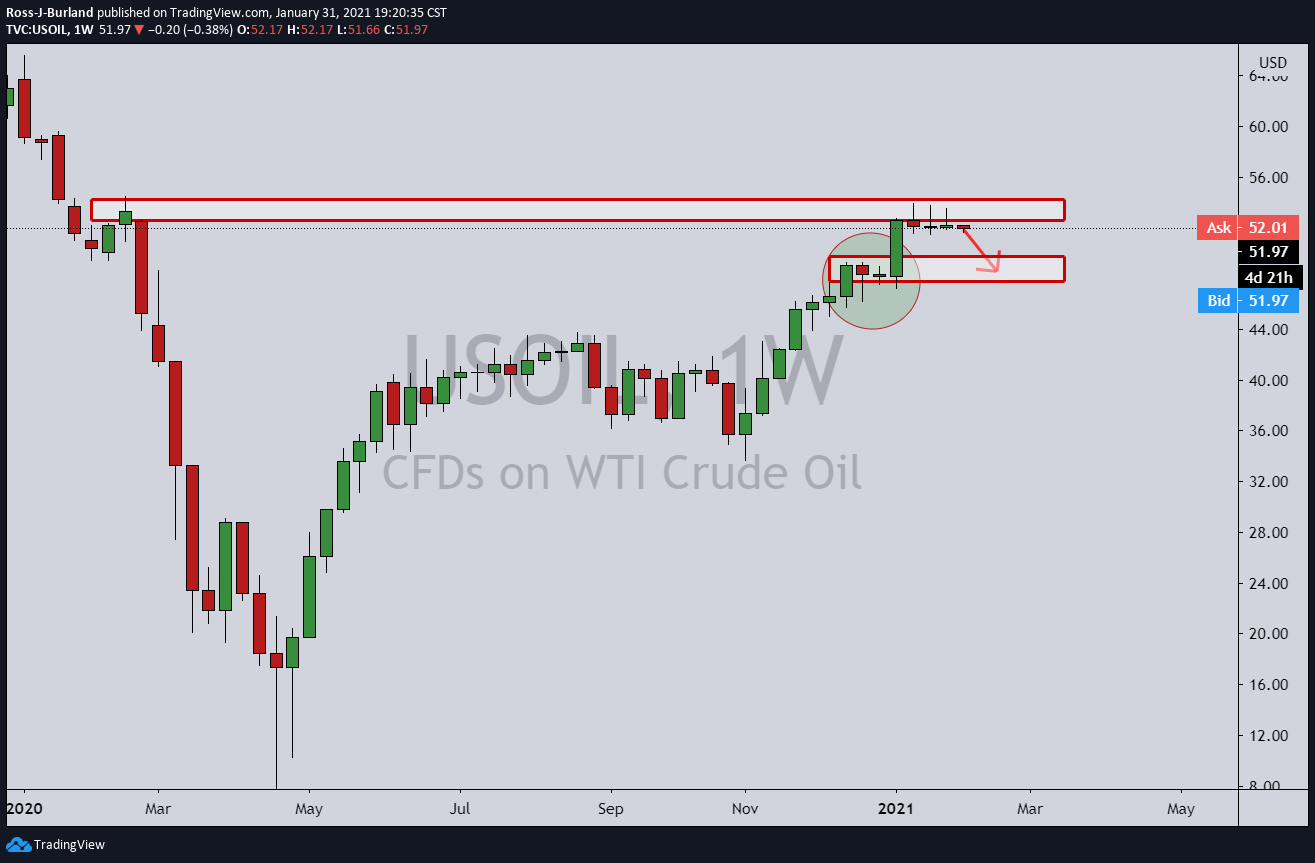
There is weekly support for which can be targetted first.
Daily chart
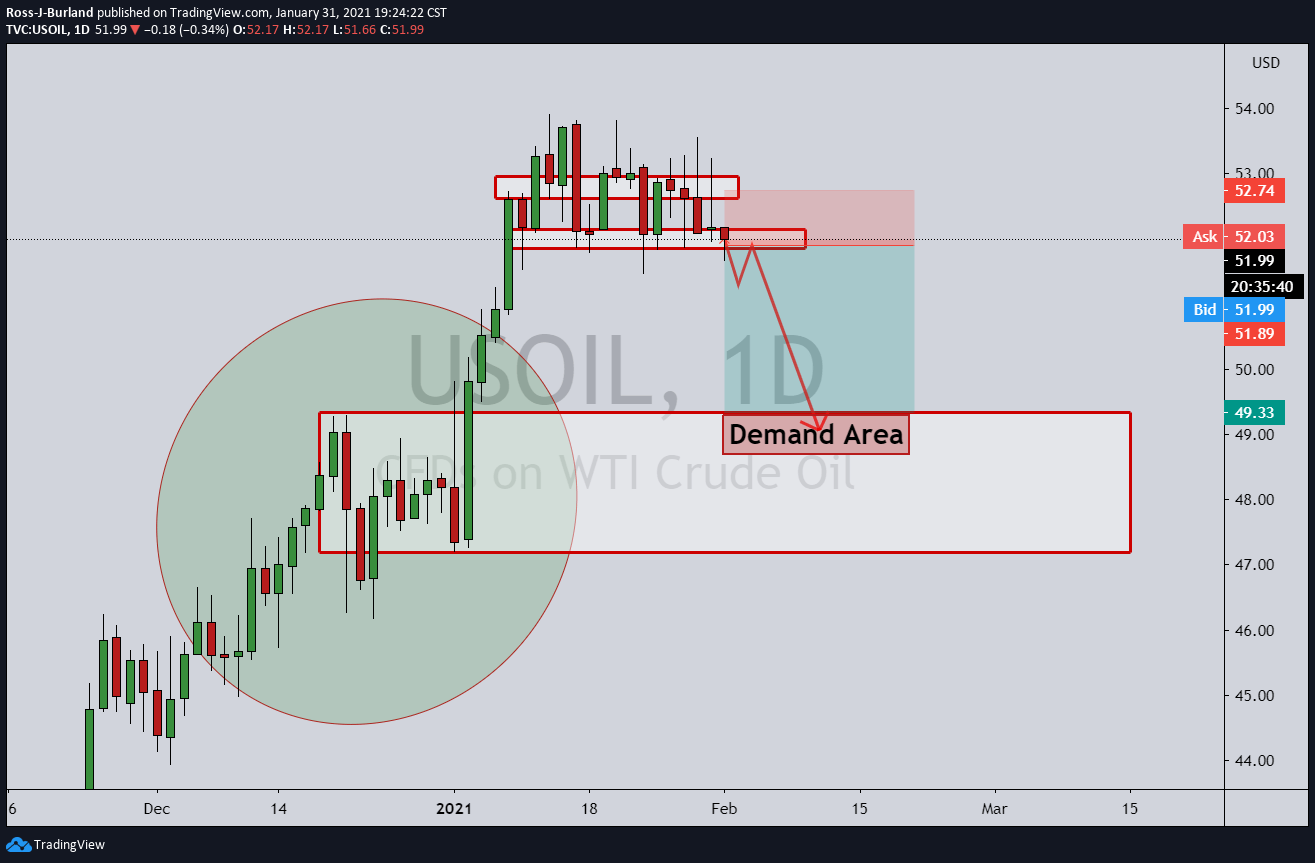
The daily chart offers the target point.
4-hour chart
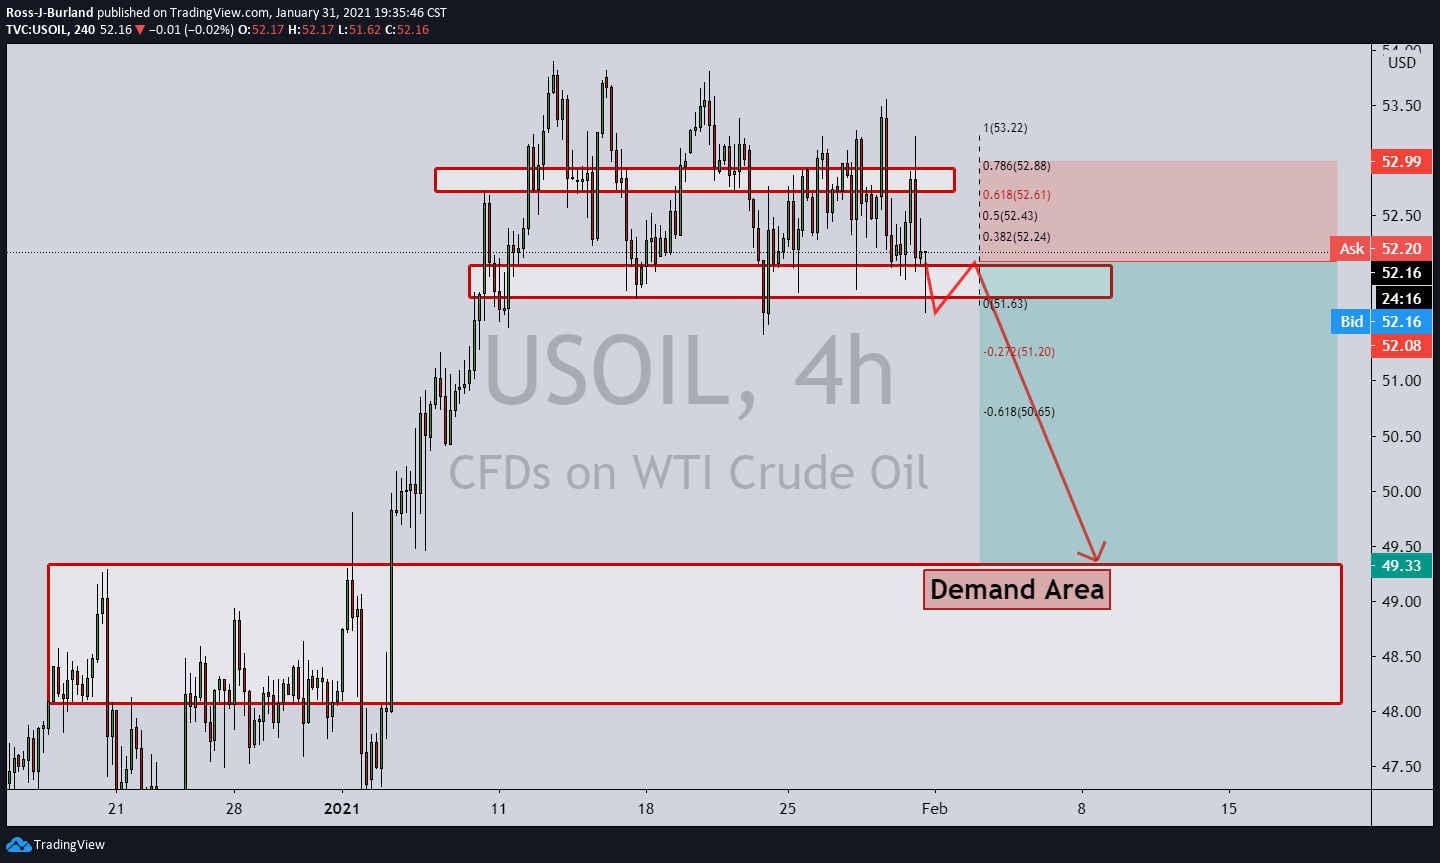
The 4-hour chart enables the trader to track the price from the structure and enter at a high volume area now that te support has been broken and restest.
A stop loss higher and above the 78.2% Fib offers a 1:3 risk to reward high probability set-up.
