- WTI seesaws inside a weekly symmetrical triangle, bounces off $42.88 recently.
- Sustained trading beyond the key SMA, normal RSI favor buyers.
- An ascending trend line from July 30 adds to the support.
WTI rises to $43.18 during the initial Asian trading on Wednesday. In doing so, the energy benchmark keeps the short-term triangle formation in play while also trading past-200-bar SMA with normal RSI strength.
As a result, buyers stay hopeful to challenge February month’s low around $44.00. However, the aforementioned triangle’s resistance, at $43.62 now, precedes the previous month’s top near $43.85 to offer immediate upside barriers.
It should also be noted that the quote’s successful rise past-$44.00 enables the bulls to challenge March month’s peak near $48.75.
Meanwhile, sellers will have multiple downside barriers to conquer before re-taking the controls. Among them, the triangle’s support line and a five-week-old rising trend line, respectively close to $42.80 and $42.60, will be the first ones to observe.
In a case where the oil prices slip below $42.60, a 200-bar SMA level of $42.10 will be the key to the downside under $41.00.
WTI four-hour chart
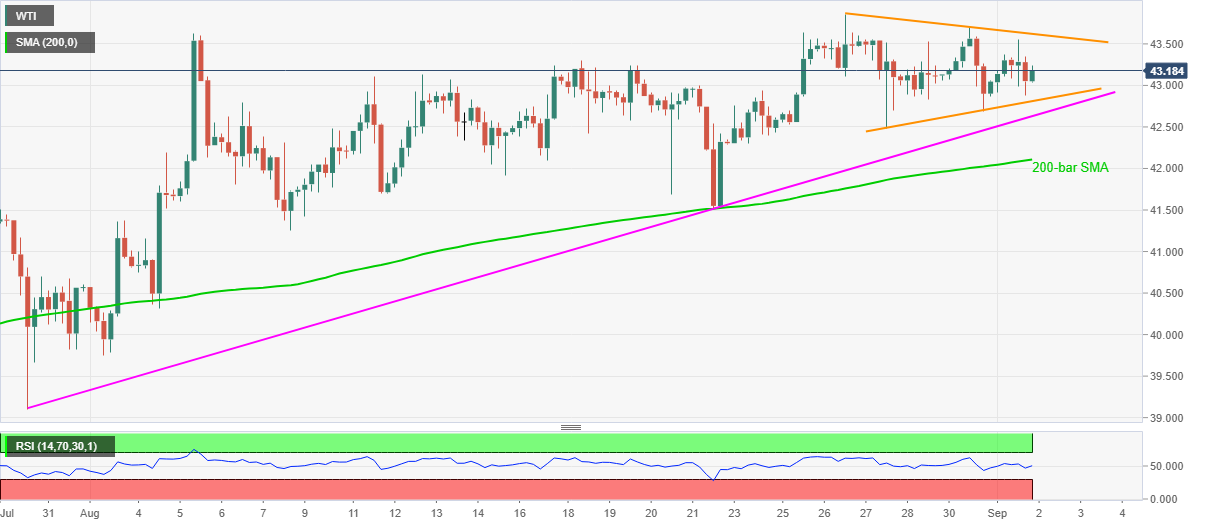
Trend: Bullish
