- WTI steps back after refreshing multi-day high, RSI drops from overbought area.
- 100-HMA adds to the downside filters, February 2020 top lures bulls.
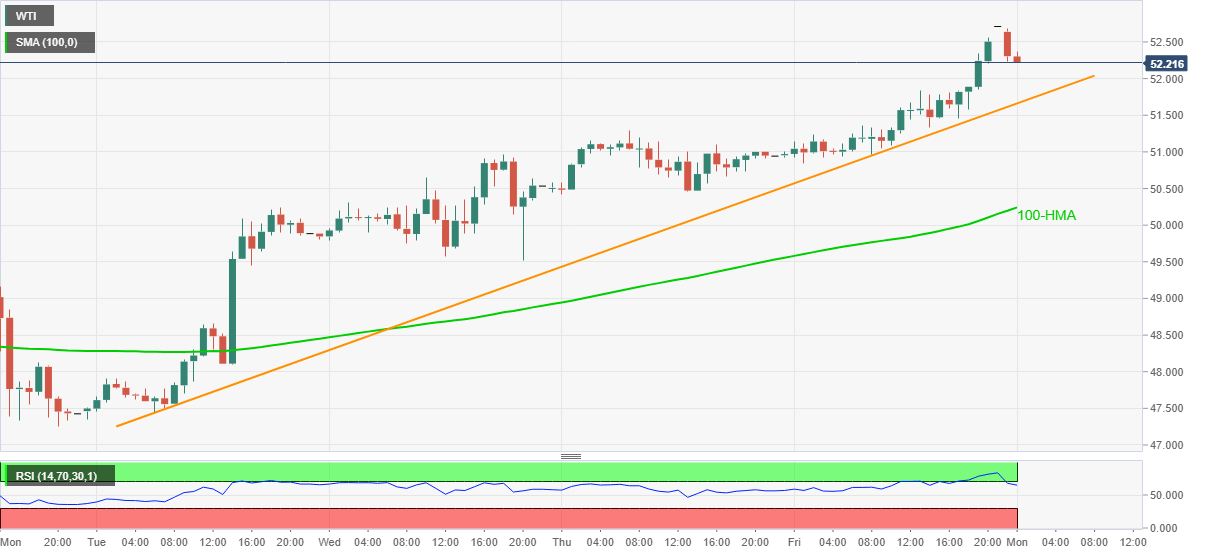
Having initially jumped to the fresh high since February 2020, WTI drops to $52.25, down 0.47% intraday, during Monday’s Asian session. The oil benchmark seems to take clues from the overbought RSI conditions while stepping back from a multi-day high.
As a result, an upward sloping trend line from last Tuesday, at $51.65 now, gains energy sellers’ attention.
However, the quote’s downside past-$51.65 will be challenged by Thursday’s high near $51.30 and the $50.00 psychological manget, not to forget the 100-HMA level of $50.25.
Meanwhile, fresh buying will eye the February 2020 peak surrounding $54.70 wherein the latest top near $52.80 and the $53.00 round-figure can offer intermediate stops during the upside.
Overall, oil prices are in an upward trajectory since early November and hence the recent pullback can be taken lightly by WTI buyers unless it breaks an upward sloping trend line from November 02, near $48.50.
WTI hourly chart
Trend: Pullback expected
