- WTI over 1.0% on the failures to stretch bounces off $38.91 beyond $40.05.
- 100-day SMA n the bears’ radar but bullish MACD can restrict further downside.
- Friday’s high adds to the upside barrier beyond the 50-day SMA.
WTI keeps the previous day’s bearish momentum while declining to $39.44, down 1.09% intraday, during the pre-European open trading on Tuesday. In doing so, the oil benchmark stretches the U-turn from 50-day SMA towards 100-day SMA.
50% Fibonacci retracement of WTI’s June-August upside, near $39.25, offers immediate support to the quote ahead of the 100-day SMA level of $38.54.
However, bullish MACD can probe the black gold’s further weakness past-$38.54 around the 61.8% Fibonacci retracement level of $38.16.
Meanwhile, 38.2% of Fibonacci retracement, at $40.33, can question WTI’s upside beyond the $40.00 threshold.
It should, however, be noted that the peak of Friday’s Doji candle, at $41.75, becomes the key resistance for buyers’ entry.
WTI daily chart
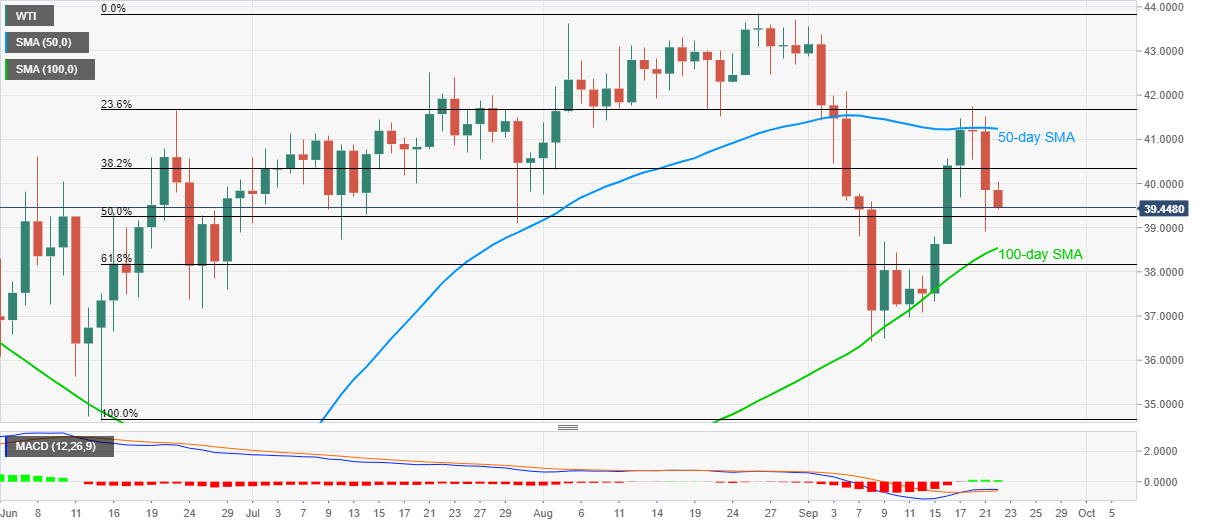
Trend: Further weakness expected
