- WTI takes a U-turn from $39.78 as 100-day EMA probes pullback moves.
- MACD histogram marks the strongest bearish signal since April 28.
- Sustained trading below 200-day, 100-day EMA keeps sellers hopeful.
WTI witnesses fresh selling while flashing $39.35 as a quote during the pre-European trading on Monday. The energy benchmark earlier dropped to $38.80 before recovering to $39.78. Though, 100-day EMA keeps the quote’s recent upside capped while also pushes the black gold to flash 0.87% losses by the press time.
In addition to the failures to cross 100-day EMA, bearish MACD also favor sellers. The MACD histogram is at the lowest levels since April 28, which in turn suggests the commodity’s further weakness.
Hence, the bears can aim for late-June lows near $37.15 during the further weakness while $38.00 may act as immediate support.
Though, any further downside past-$37.15 will make the sellers aim for June month’s low, also including May month’s top, near $34.60.
Alternatively, 100-day and 200-day SMA, $39.75 and $41.83 respectively, will act as nearby strong resistances for the traders to watch in addition to $40.00 round-figures.
It should, however, be noted that the bulls will remain cautious unless the quote manages to cross February month’s low near $44.00.
WTI daily chart
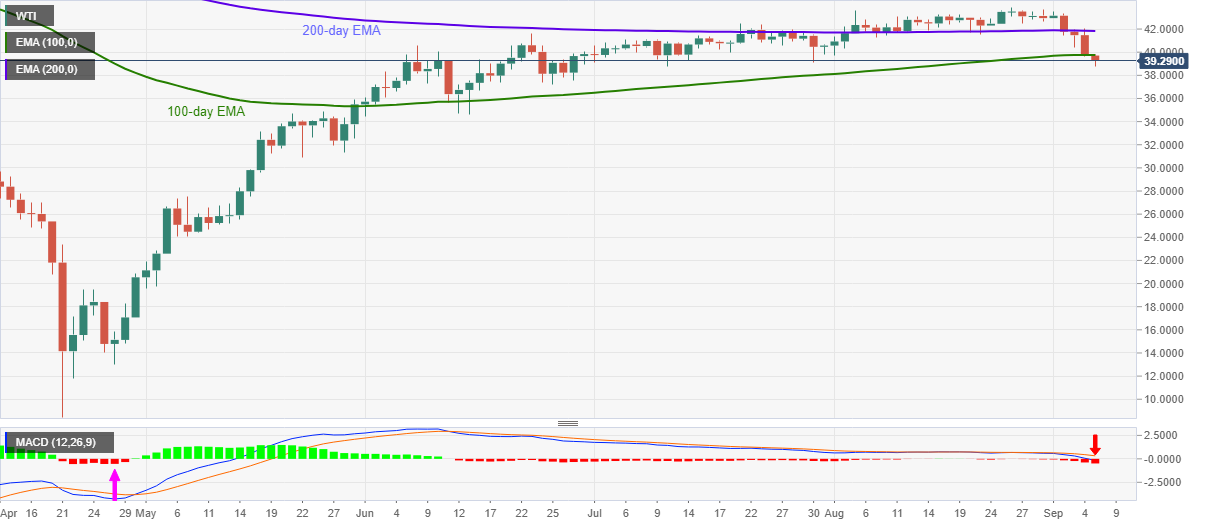
Trend: Bearish
