- WTI recovers from a 13-month low.
- An upside break of $51.20 will confirm the bullish chart pattern.
- Late-December 2018 tops will gain sellers’ attention during further declines.
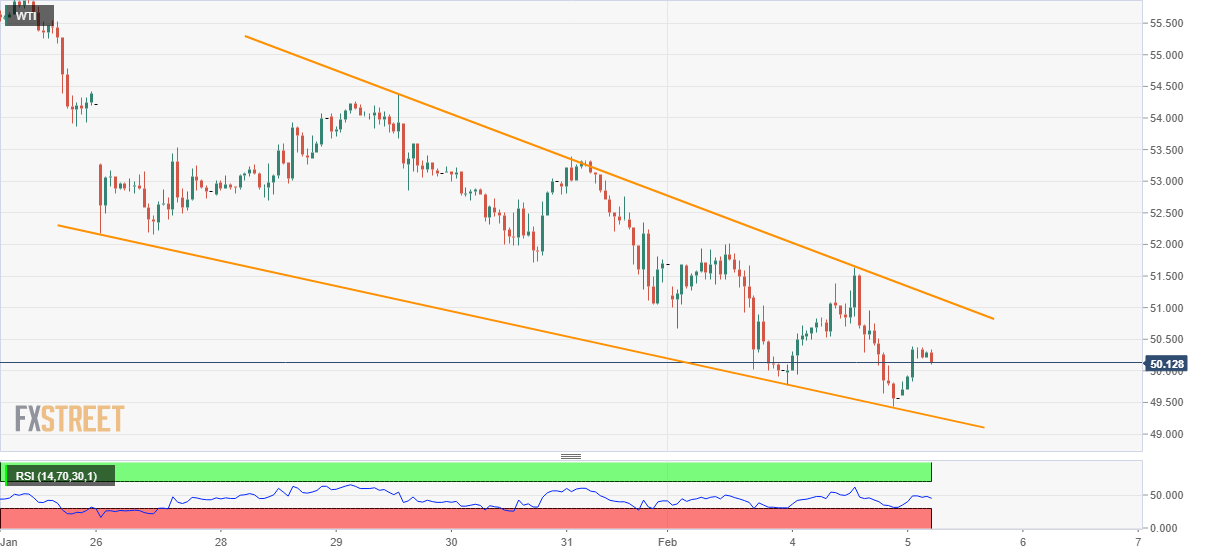
WTI trades around $50.15 ahead of the European session on Wednesday. The energy benchmark recently bounced off from January 2019 lows. In doing so, it portrayed a short-term bullish chart pattern.
However, an upside clearance of $51.20 becomes necessary for the formation to get confirmed.
Should that happen, the black gold’s theoretical target of $55.20 could avail stops near $53.40 and $54.40 intermediate upside barriers.
Alternatively, the pattern’s support-line, currently around $49.30, will restrict the immediate declines.
In a case where oil prices continue to slide past-$49.30, December 19, 2018 top near $48.40 may gain the sellers’ attention.
WTI hourly chart
Trend: Pullback expected
