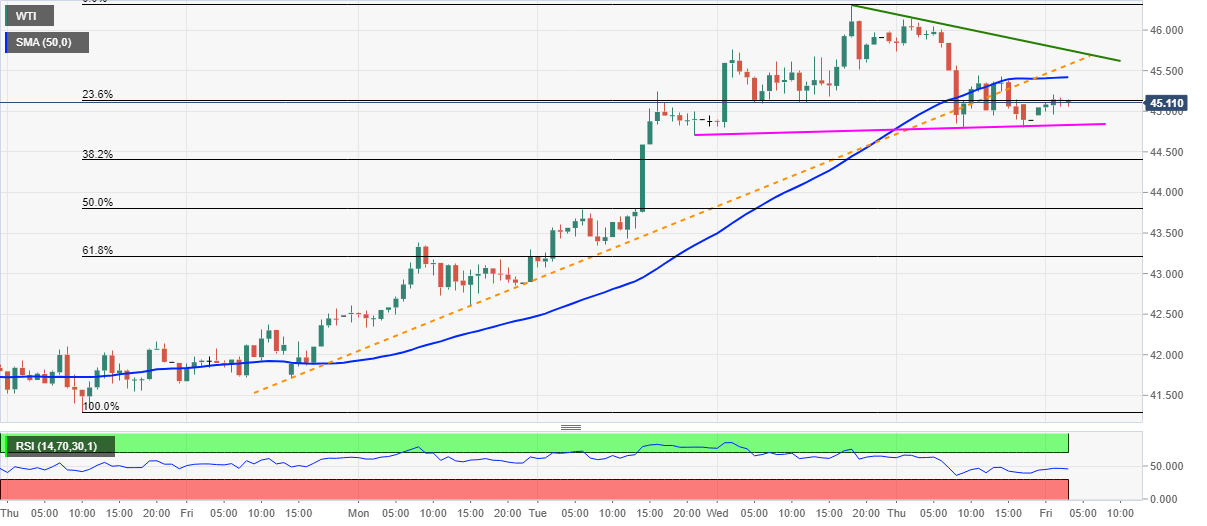
- WTI fades bounces off three-day-old support line, stays above $45.00.
- Normal RSI conditions suggest further recovery, 50% of Fibonacci retracement lures bears below trend line support.
Having initially extended the previous day’s recovery mover from $44.79, WTI eases to $45.10 during early Friday. In doing so, the energy benchmark keeps the downside break of 50-HMA and an ascending trend line from November 20.
However, an immediate support line from Tuesday restricts the quote’s short-term declines, around $44.83, before the previous day’s low near $44.79.
While RSI conditions suggest further consolidation of losses towards 50-HMA and previous support line, respectively around $45.40 and $45.60, a two-day-long resistance line near $45.75/80 could challenge the energy bulls afterward.
In a case where the oil prices rise beyond $45.80, the recently flashed multi-month high of $46.30 and March month’s high near $48.85 gains market attention.
Alternatively, a downside break below $44.79 will eye 50% Fibonacci retracement of November 19-25 advances, at $43.80.
Should there be further declines below $43.80, November 23 high near $43.40 may return to the charts.
WTI hourly chart
Trend: Further recovery expected

