- WTI ticks up on the latest market-positive news.
- MACD teases the buyers below short-term key resistances.
- $19.00 has been acting up to limit the downside.
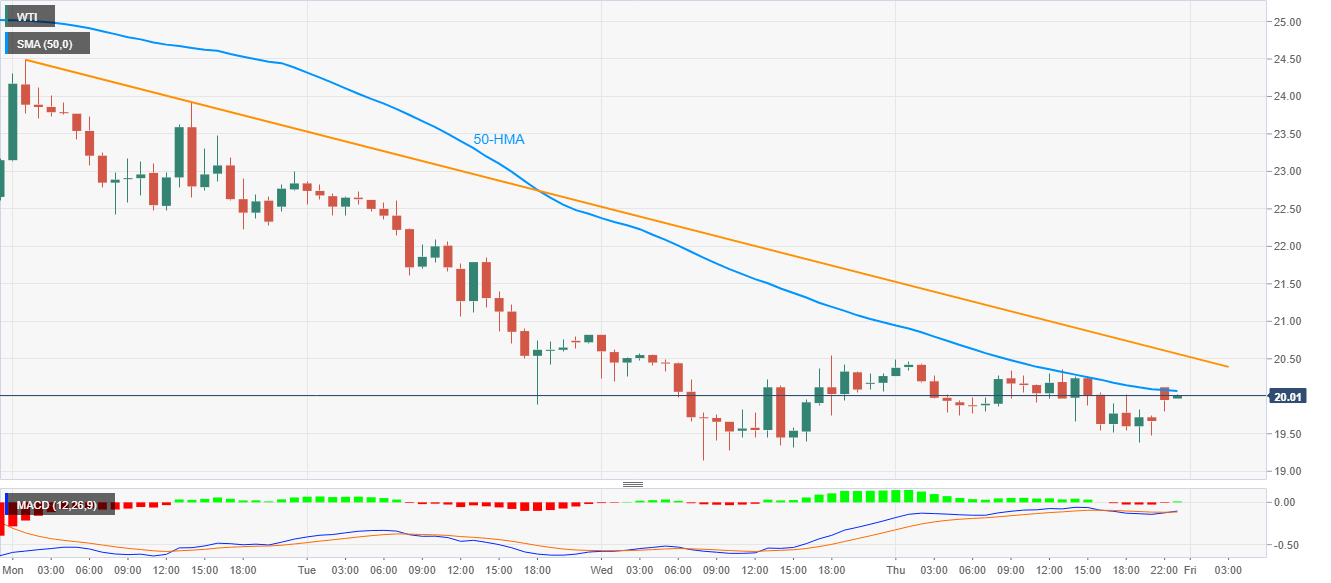
Having ticked up to $19.67 to $20.12 at the start of the Asian morning, WTI seesaws around $20.00 during the early session’s trading. In doing so, the black gold jostles with 50-HMA that holds the gate for another upside filter, namely the descending trend line from Monday.
Given the MACD signals, coupled with repeated pullbacks from $19.00, the energy benchmark is likely to cross the $20.10 and $20.65 immediate resistances.
In doing so, Tuesday’s high near $23.00 could offer an intermediate halt during the run-up to the weekly top surrounding $24.50.
Meanwhile, the commodity’s sustained downside trading below $19.00 will open ways for the bears to target 2001 bottom close to $16.40.
WTI hourly chart
Trend: Pullback expected
