- WTI registers four-day losing streak, stays below short-term resistance line.
- March-end low appears nearby on the bears’ radar.
- Buyers will look for entry beyond 200-HMA.
Having failed to reverse the previous day’s losses during early Asia, WTI stays under pressure around $20.50 ahead of the European session on Wednesday.
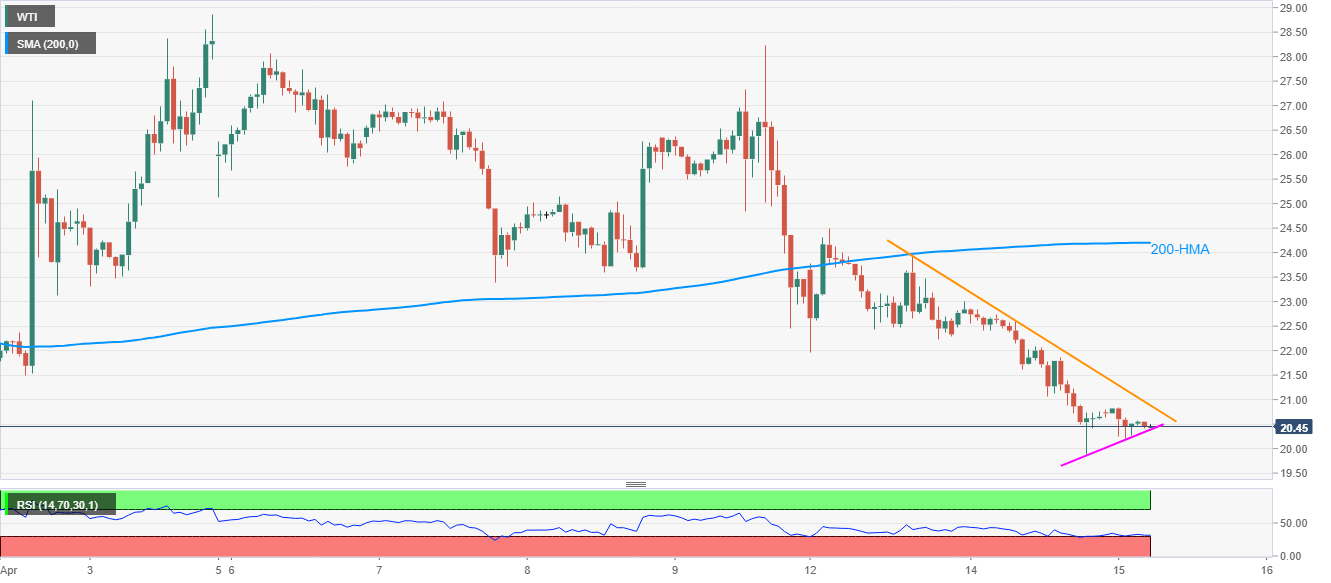
That said, the energy benchmark remains below the one-week-old descending trend line while also being under 200-HMA. Though, nearly oversold RSI conditions limit the quote’s further downside.
Hence, sellers await the oil price declines below the immediate rising support line, at $20.40 now, to aim for the March month low around $19.00.
On the contrary, an upside clearance above the immediate resistance line, close to $21.00, can aim for Friday’s low near $22.00 before targeting the 200-HMA level surrounding $24.20.
It should, however, be noted that the black gold’s sustained run-up beyond 200-HMA enables it to accelerate the recovery moves to the monthly top around $29.00.
WTI hourly chart
Trend: Bearish
