- WTI seesaws around 7-week-old resistance line, retreats from highest since March 11.
- A short-term ascending trend line on the bears’ radars during the pullback.
- 100-day SMA, 61.8% Fibonacci retracement together offers strong upside barrier.
WTI fades the early-Asian session upside momentum while taking rounds to $35.50 amid the initial trading on Monday.
In doing so, the black gold seesaws around 12-week top while clinging to an upward sloping trend line from April 09 amid overbought RSI conditions.
As a result, sellers are looking for an entry during the energy benchmark’s drop below $35.00 to visit an ascending support line stretched since May 14, 2020, at $32.34 now.
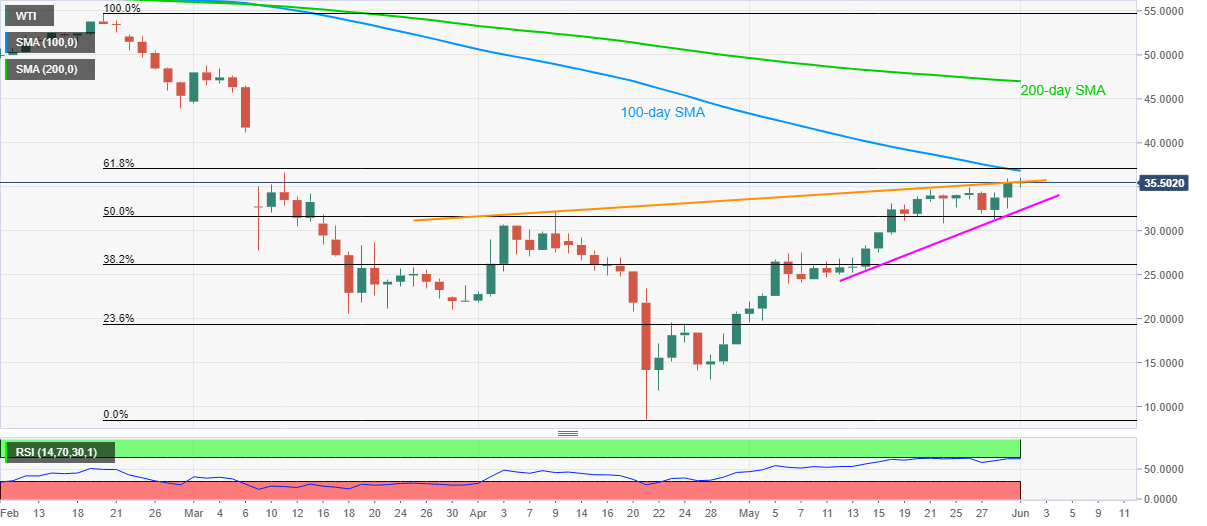
If at all the buyers manage to provide a daily closing beyond the said resistance line above $35.55, a confluence of 100-day SMA and 61.8% Fibonacci retracement of February-April fall near $36.80-37.00 will be in the spotlight.
WTI daily chart
Trend: Pullback expected
