- WTI fails to respect the bounce off $39.53 while gaining around 0.20%.
- One-week-old resistance line offers immediate upside barrier.
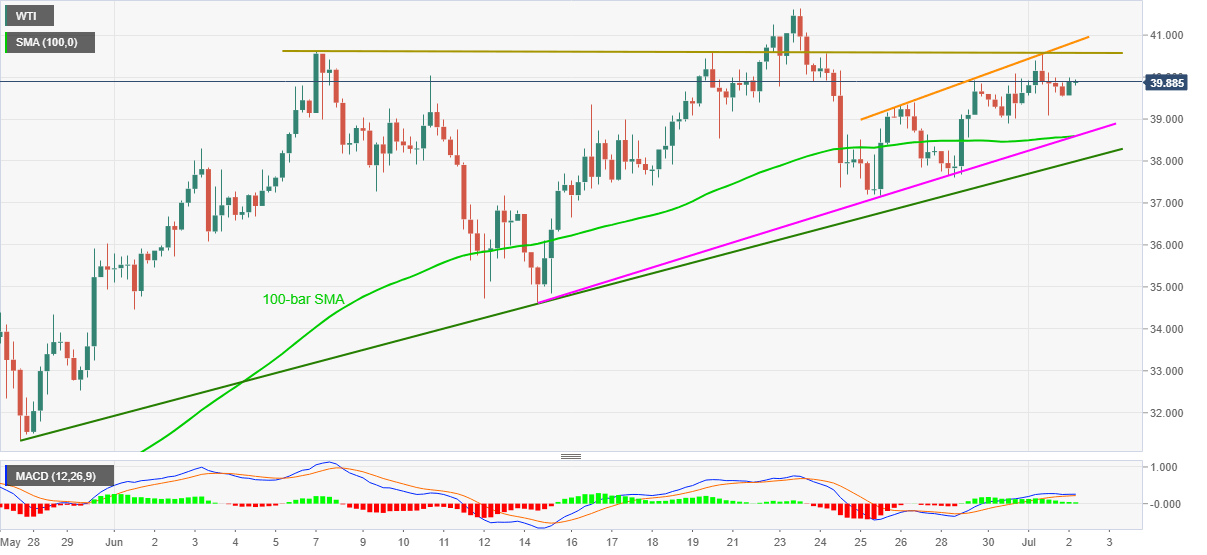
- $38.60 and a five-week-old ascending trend line become the key support.
WTI recedes to $39.83, up 0.19% on a day, during the pre-European session on Thursday. The oil benchmark recently marked multiple failures to cross the $40.00 threshold. However, bullish MACD and upbeat formations on the four-hour chart keep buyers hopeful.
With this in mind, a horizontal line since the early June month, around $40.60, could lure the optimists beyond $40.00. Though, an ascending trend line from June 25, at $40.85 now, might challenge any further upside.
In a case where the oil prices manage to stay strong past-$40.85, the previous monthly top surrounding $41.65 and February month’s bottom close to $44.00 can return to the charts.
Alternatively, a confluence of 100-bar SMA and a rising trend line from June 15, near $38.60, followed by another support line from May 27 close to $38.00, can restrict the quote’s short-term downside.
If at all the black gold fail to bounce from $38.00, odds of its drop to the mid-June low surrounding $34.60 can’t be ruled out.
WTI four-hour chart
Trend: Sideways to positive
