- WTI sellers attack $40.00 while extending U-turn from three-week high.
- Bullish MACD keeps energy buyers hopeful above 200-day SMA.
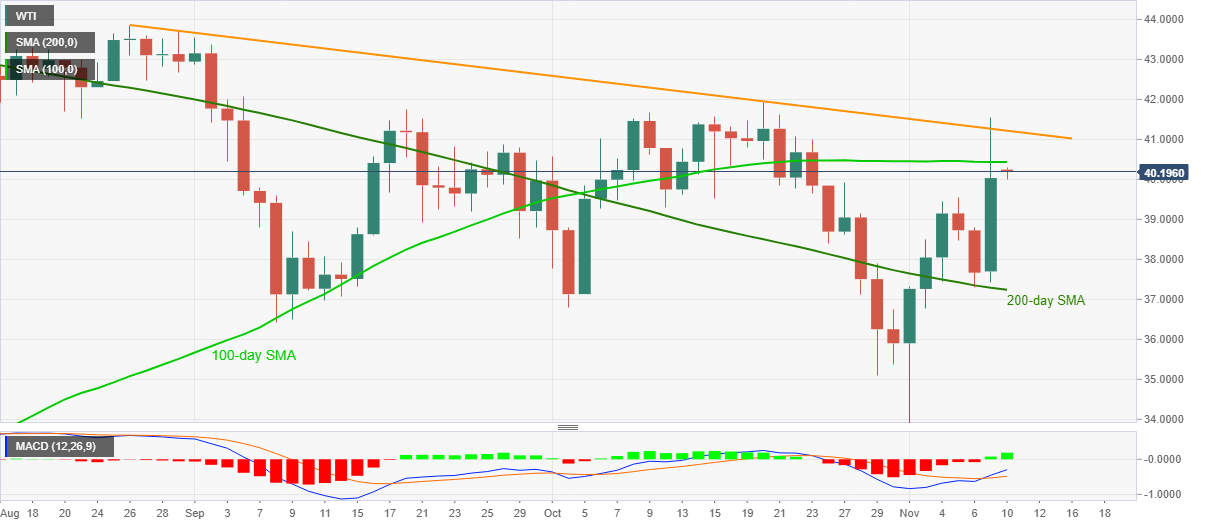
- October high adds to the upside barriers, before key SMA, trend line resistance.
WTI drops toward $40.00, down 0.50% on a day, during the pre-Tokyo open trading on Tuesday. The black gold surged to the highest since October 21 on Monday, before stepping back from $41.55.
In doing so, the oil benchmark marked a failure to cross the descending trend line from August 26 while also declining below 100-day SMA.
Although the recent consolidation can fetch quote back to last Thursday’s high of $39.55, on the break below the $40.00 threshold, the 200-day SMA level of $37.24 offers strong support to the commodity prices amid bullish MACD.
Also acting as downside supports are lows marked in October and September, respectively around $36.80 and $36.40.
Meanwhile, the previous month’s peak surrounding $41.95 offers an extra challenge to WTI bulls even if they manage to cross 100-day SMA and the stated resistance line, near $40.45 and $41.20 in that order.
WTI daily chart
Trend: Further weakness expected
