- WTI seesaws around $46.38-63 after rising to the fresh high since March 2020.
- Confirmation of the bullish chart pattern, lack of overbought RSI favors the oil buyers.
- 200-bar SMA offers key support, pullback moves can aim for the early-November top.
WTI picks up the bids near $46.50, up 1.75% intraday, while taking rounds to the nearly 25-pip trading range during early Friday. The energy benchmark recently surged to $46.63, the highest level in months, after confirming the bullish flag chart pattern on the four-hour play.
Not only the confirmation of the bullish formation but absence of the overbought RSI conditions also suggests further increase in the price of the black gold.
As a result, a gradual run-up towards the March 2020 high near $48.70 becomes more expected.
Following that, February low near $49.45 and the $50.00 round-figure will gain the bulls’ attention.
On the downside, pullback moves below the flag’s upper line, at $45.40 now, may revisit the flag’s support, currently around $43.75.
Though, any further weakness below $43.75 will eye the November 11 top near $43.30.
WTI four-hour chart
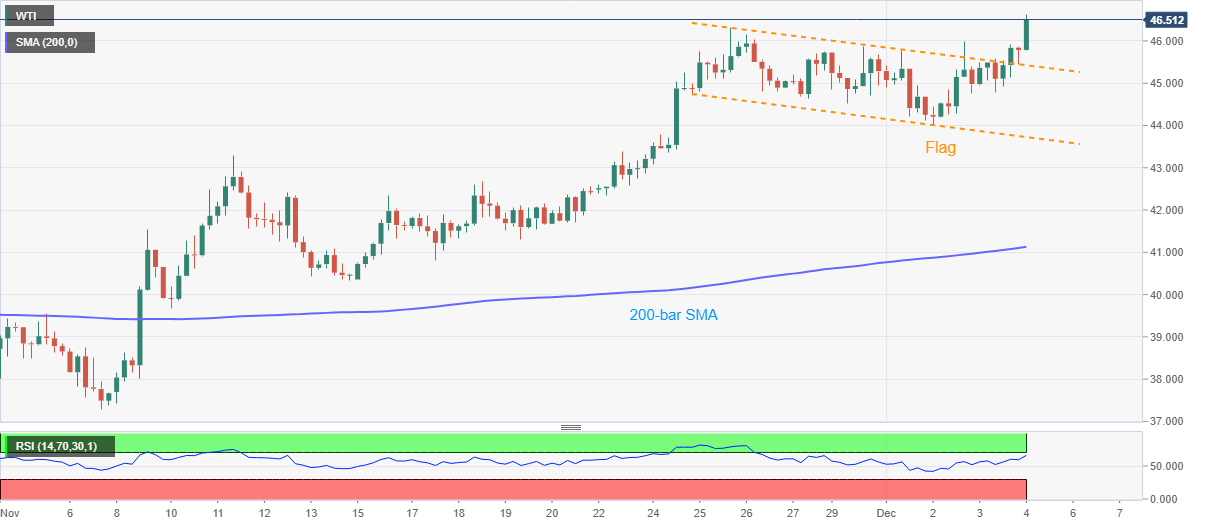
Trend: Bullish
