- WTI fails to hold onto recovery gains beyond $34.05.
- Sellers await confirmation of the bearish technical pattern.
- Buyers will have to refresh monthly top to question 100-day EMA.
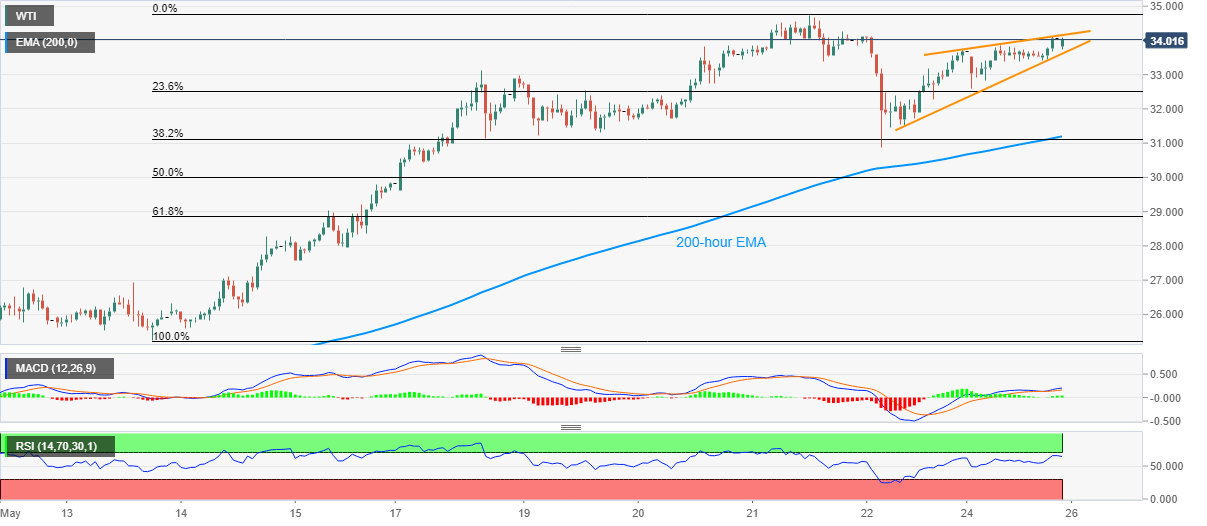
WTI takes around to $34.00 amid the early Tuesday morning in Asia. While stepping back from $34.05, the oil benchmark seems to portray the rising wedge bearish technical formation on the hourly chart that needs confirmation with a downside break below $33.60.
Should the quote declines below $33.60, which can be anticipated considering the RSI conditions, sellers can aim for a 200-hour EMA level of $31.20 ahead of looking at Friday’s low near $30.90.
During the quote’s further downside past-$30.90, $30.00 may act as a buffer before pleasing the bears with a $28.85 mark comprising 61.8% Fibonacci retracement of Mat 13-21.
Meanwhile, an upside clearance of the monthly high near $34.75 becomes necessary for the bulls to keep the reins.
In doing so, 100-day EMA on the daily chart around $35.40 can gain their immediate attention ahead of March 11 top near $36.65.
WTI hourly chart
Trend: Pullback expected
