- WTI fails to stay positive above $39.00 as an ascending trend line from May 27 probes the bulls.
- Horizontal support comprising Wednesday’s low, Monday’s top limit immediate downside.
- 200-HMA could lure the bears whereas $40.00 and the monthly high add challenges for the buyers.
WTI drops to $38.55, but gaining 0.52% on a day, while heading into the European session on Tuesday.
Although a horizontal line comprising recent lows restricts the black gold’s immediate downside, a nine-day-old upward sloping trend line, previous support, guard the nearby advances.
As a result, the oil benchmark seems to have been capped between $38.15 horizontal support and $39.20 support-turned-resistance.
In a case of either side breaks, a 200-HMA level of $36.38 and $40.00 round-figures will gain the market’s attention.
It should also be noted that the monthly high around $40.60 and June 01 low near $34.45 are some extra filters to check while observing the oil price moves.
WTI hourly chart
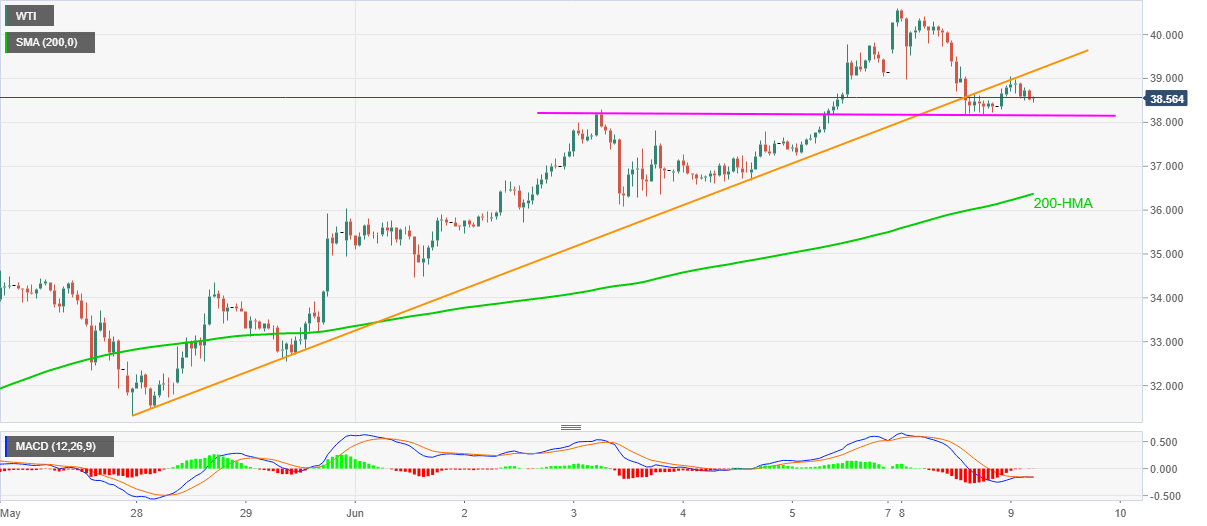
Trend: Pullback expected
