- WTI slips below the weekly support trend line.
- 200-bar EMA, late-January tops can please buyers during the upside break.
- 23.6% of Fibonacci retracement will question sellers.
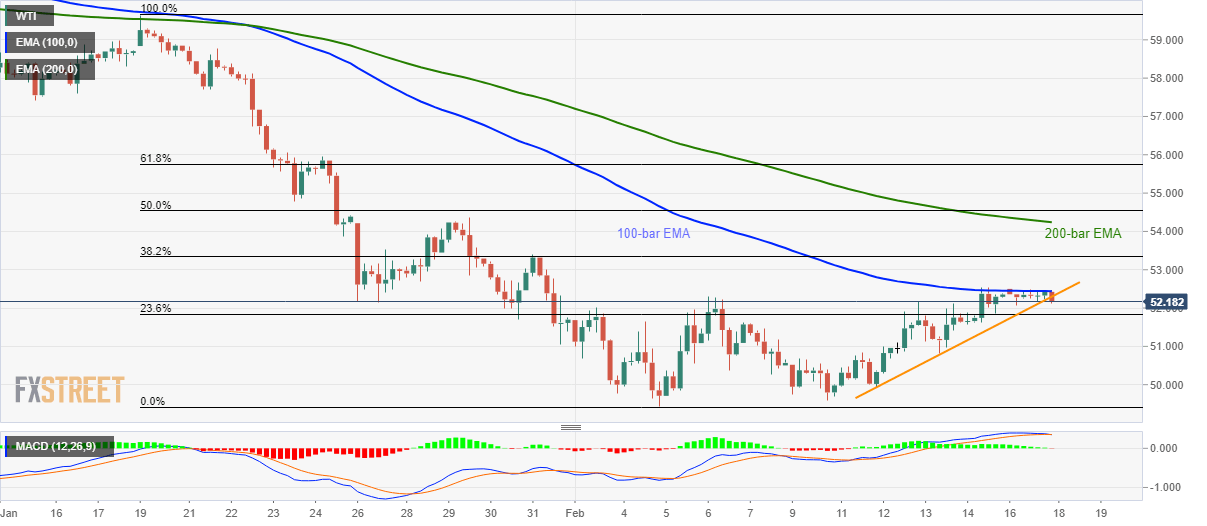
WTI declines to $52.20 during the Asian session on Tuesday. The energy benchmark recently dropped below the short-term ascending support line while extending its weakness below 100-bar EMA.
That said, the black gold now drops towards 23.6% Fibonacci retracement of its January 19 to February 04 fall, at $51.83.
However, the quote’s further declines can recall early-monthly tops near $50.40 ahead of highlighting $50.00 and the monthly low, also the multi-month bottom, surrounding $49.40.
Meanwhile, oil price rally beyond 100-bar EMA level of $52.45 will trigger fresh recovery towards 38.2% Fibonacci retracement level of $53.35.
Though, a confluence of 200-bar EMA and late-January highs could then question the buyers around $54.25/30.
WTI four-hour chart
Trend: Bearish
