- WTI stalls the bounce above $40 as hourly RSI turns flat.
- A firm break above $40.50 is needed for the further upside.
- 200-HMA guards the downside ahead of the API crude stocks data.
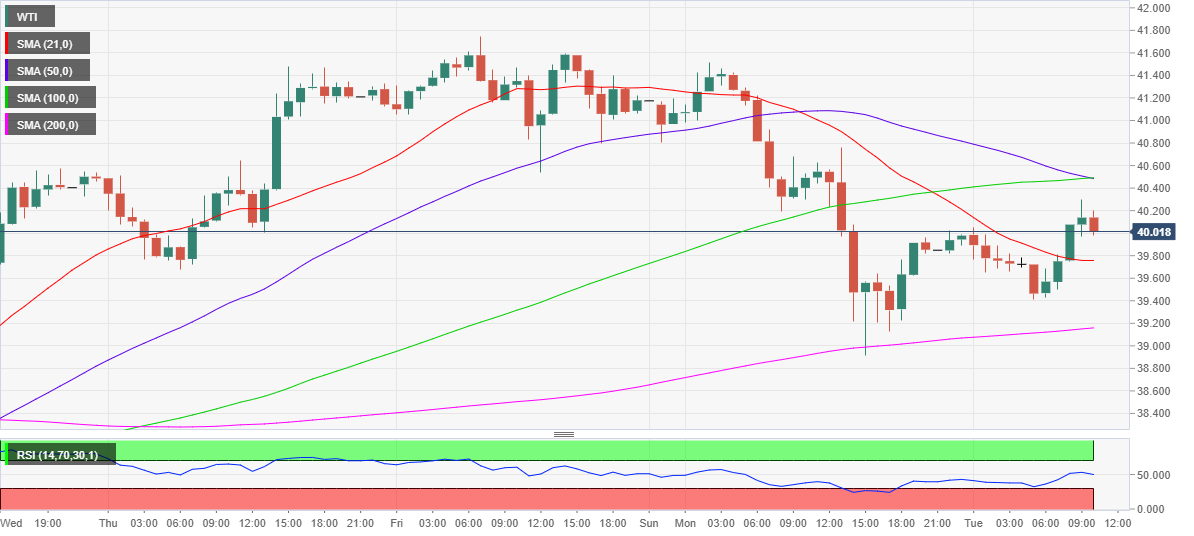
WTI (futures on NYMEX) consolidates the bounce above the $40 barrier, having regained the 21-hourly Simple Moving Averages (HMA), currently at $39.75.
The US oil traders have turned cautious ahead of the American Petroleum Institute’s (API) weekly crude stockpiles data release.
The rebound in the black gold faltered below the critical $40.50 barrier, which is the confluence of the 100 and 50-HMAs.
A break above which doors will open towards the $41 mark. The next upside target for the bulls will be the Monday high of $41.51.
To the downside, the immediate cushion is seen at the previous resistance now support at 21-HMA. A failure to resist above the latter could call for a test of the horizontal 200-HMA at $39.16.
The hourly Relative Strength Index (RSI) has turned south, suggesting that the recovery momentum appears to have fizzled out.
WTI hourly chart
WTI additional levels
