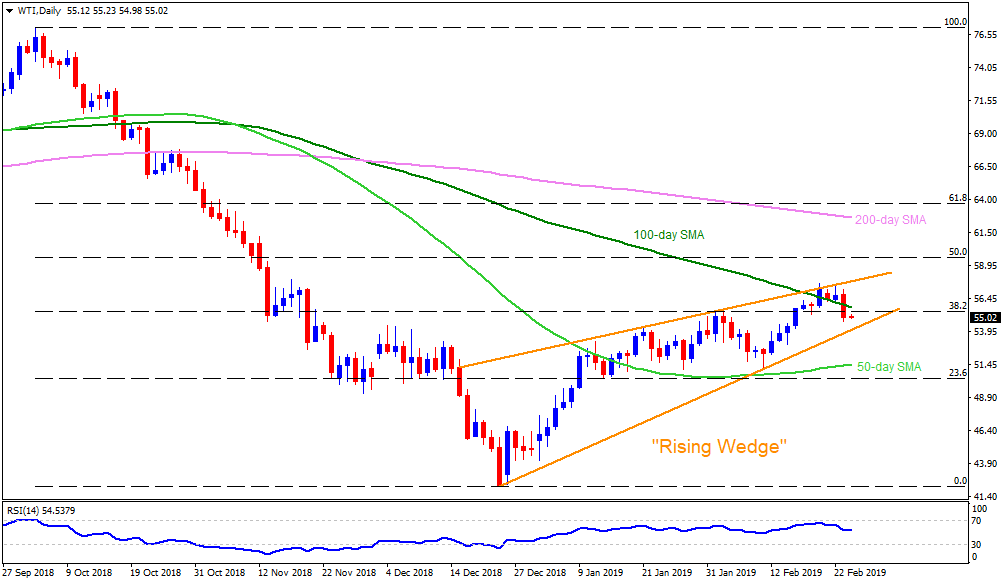
WTI daily chart WTI trades around $55.20 during early Asian sessions on Tuesday. The crude benchmark maintains its position below 100-day simple moving average (SMA) with gradually softening 14-day relative strength index (RSI) highlighting the importance of $53.90 support including an upward slanting support-line connecting lows of December and February. If we also look at the ascending trend-line joining highs marked since mid-December, there prevails a “rising wedge” bearish formation between $53.90 and $57.80 on the play. Hence, a sustained downside break of $53.90 can confirm the bearish technical pattern and may open doors for its decline towards 50-day SMA level of $51.45 and then to 23.6% Fibonacci retracement of its October-December downturn, at $50.30. In doing so, $53.00 and $52.40 may offer intermediate halts to the south-run. Alternatively, 100-day SMA level of $55.85 could act as nearby resistance, a break of which can escalate the moves to $57.20. If at all prices rally beyond $57.20, $57.80 might challenge bulls failing to which could recall $59.30 and $60.00 on the chart.
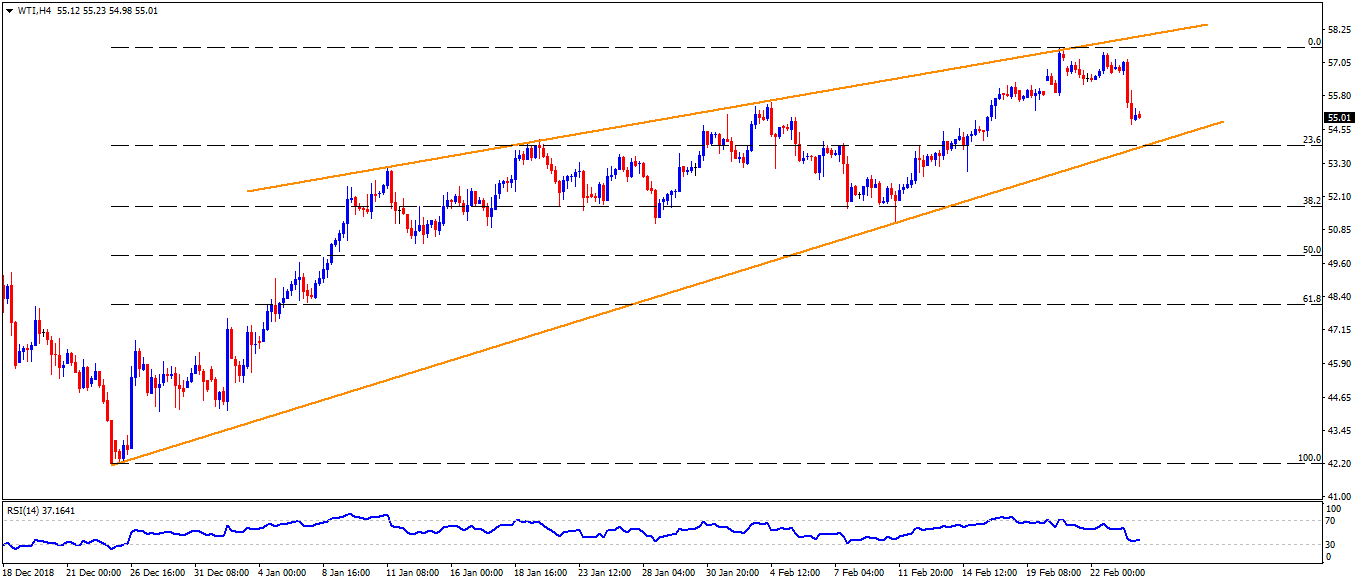
 WTI 4-Hour chart While a break of $53.90 signals the energy benchmarks slid to $51.45 on the daily chart, there prevails an intermediate halt at $51.70 as shown by the 38.2% Fibonacci retracement of December – February moves. On the upside, $56.30 may become a buffer between $55.85 and $57.20 levels.
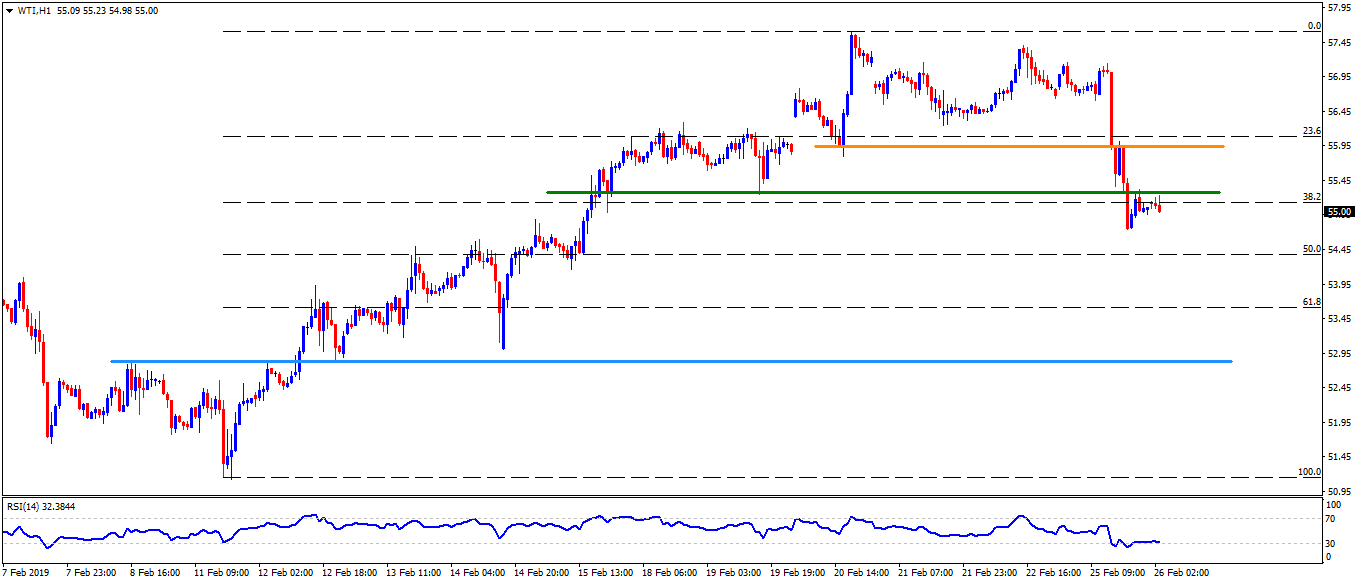
 WTI hourly chart Having breached $55.30 horizontal support, now acting as resistance, WTI may revisit $54.70 prior to taking rest on $53.90 whereas $52.80 can flash on sellers’ radar then after. Meanwhile, an upside clearance of $55.30 highlighting $55.85 and $56.30 for short-term buyers. FX Street FX Street FXStreet is the leading independent portal dedicated to the Foreign Exchange (Forex) market. It was launched in 2000 and the portal has always been proud of their unyielding commitment to provide objective and unbiased information, to enable their users to take better and more confident decisions. View All Post By FX Street FXStreet News share Read Next GBP/JPY Technical Analysis: Prints 3.5-month highs in Asia, 1H RSI creates lower highs FX Street 4 years WTI daily chart WTI trades around $55.20 during early Asian sessions on Tuesday. The crude benchmark maintains its position below 100-day simple moving average (SMA) with gradually softening 14-day relative strength index (RSI) highlighting the importance of $53.90 support including an upward slanting support-line connecting lows of December and February. If we also look at the ascending trend-line joining highs marked since mid-December, there prevails a "rising wedge" bearish formation between $53.90 and $57.80 on the play. Hence, a sustained downside break of $53.90 can confirm the bearish technical pattern and may open doors for its decline towards 50-day SMA… Regulated Forex Brokers All Brokers Sponsored Brokers Broker Benefits Min Deposit Score Visit Broker 1 $100T&Cs Apply 0% Commission and No stamp DutyRegulated by US,UK & International StockCopy Successfull Traders 9.8 Visit Site FreeBets Reviews$100Your capital is at risk. 2 T&Cs Apply 9.8 Visit Site FreeBets Reviews$100Your capital is at risk. 3 Recommended Broker $100T&Cs Apply No deposit or withdrawal feesTrade major forex pairs such as EUR/USD with leverage up to 30:1 and tight spreads of 0.9 pips Low $100 minimum deposit to open a trading account 9 Visit Site FreeBets ReviewsYour capital is at risk. 4 T&Cs Apply Visit Site FreeBets ReviewsYour capital is at risk. 5 Recommended Broker $0T&Cs Apply Trade gold, silver, and platinum directly against major currenciesUp to 1:500 leverage for forex trading24/5 customer service by phone and email 9 Visit Site FreeBets ReviewsYour capital is at risk.