- WTI takes the bid towards the 61.8% Fibonacci retracement.
- Bearish MACD highlights the weakness in momentum.
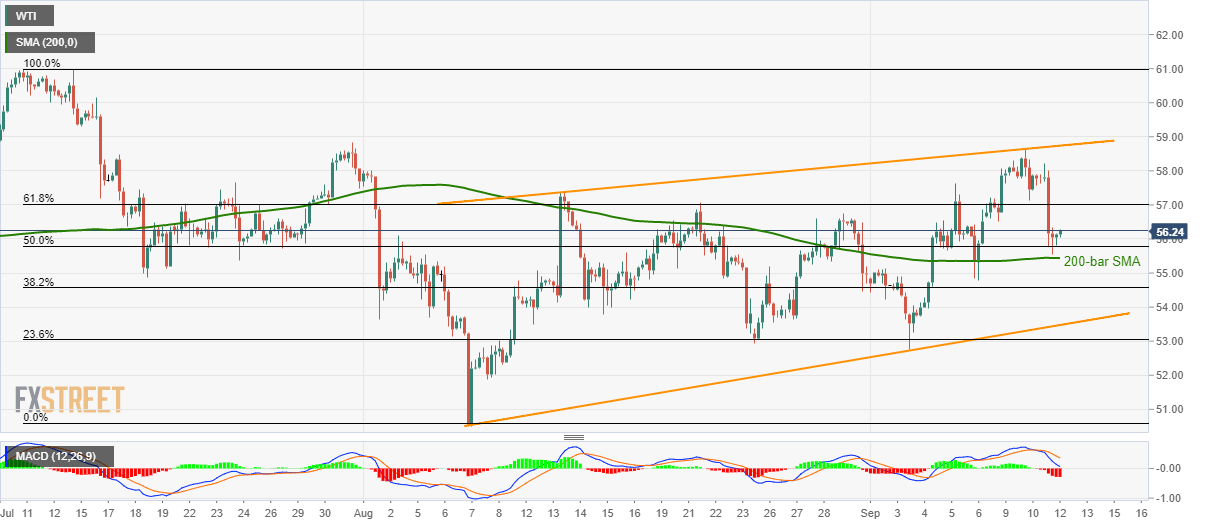
With its yet another bounce off 200-bar simple moving average (SMA), WTI flashes near $56.30 mark during Thursday’s Asian session.
The quote now aims to confront 61.8% Fibonacci retracement of July-August declines, at $57.00. However, a four-week-old rising trend-line around $58.75 could question further upside.
Contrast to the latest pullback, 12-bar moving average convergence and divergence (MACD) indicator shows a bearish signal and indicates the pair’s break below $55.45 key SMA level.
As a result, 38.2% Fibonacci retracement level of $54.55 could be considered as immediate support ahead of watching over the rising trend-line since August 07, at $53.50.
During the pair’s decline below $53.50, August 08 low surrounding $51.80 will gain sellers’ attention.
WTI 4-Hour chart
Trend: pullback expected
