- WTI witnesses mild recovery inside the four-day-old symmetrical triangle.
- 61.8% of Fibonacci retracement will be on sellers’ radar after 200-HMA.
- An upside clearance of the triangle needs validation from $60.00.
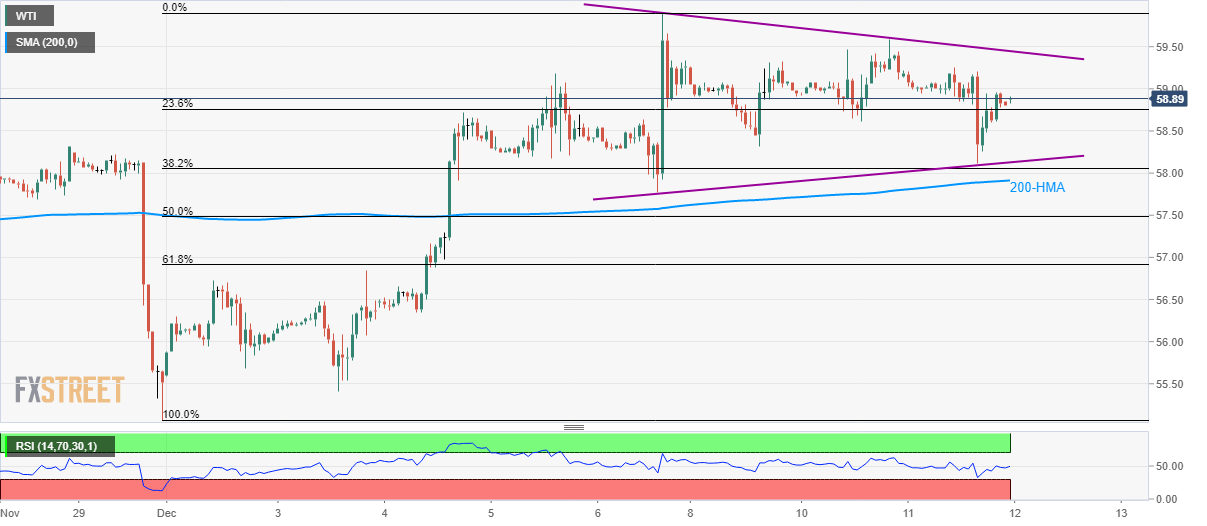
WTI remains mildly bid around $58.90 amid Thursday’s Asian session. The energy benchmark has been trading sideways since late in the last week while staying above the 200-Hour Simple Moving Average (HMA).
The quote currently aims for the triangle resistance, at $59.45, a break of which could trigger fresh run-up to the monthly top of $59.90.
Though, the black gold’s upside past-$59.90 depends upon how strong it manages to remain beyond $60.00.
Meanwhile, the formation support of $58.13 nears a 200-HMA level of $57.91 to limit immediate price declines.
Should there be a downtick after $57.90, 61.8% Fibonacci retracement of November 29 to December 06 upside, at $56.90, will lure the Bears.
WTI hourly chart
Trend: Sideways
