- U-turn from 50% Fibonacci retracement highlights horizontal support-line.
- RSI conditions may question additional declines.
Pullbacks from $59.00 portray WTI weakness that drags the energy benchmark to $58.50 ahead of European open on Monday.
If oversold levels of 14-bar relative strength index (RSI) are ignored, prices can well slip under $57.80 horizontal-line that connects February and March month high to recent lows.
In doing so, 61.8% Fibonacci retracement of February to April month upside, at $57.00, can offer an intermediate halt during the quote’s drop to $55.60 and $55.00.
Alternatively, sustained break of 50% Fibonacci retracement of $59.00 can trigger the black gold’s uptick towards breaking $60.00 round-figure and aim for 38.2% Fibonacci retracement near $60.76.
In a case where prices rally beyond $60.76, $62.40 and a month old descending trend-line near $63.30 may as well flash on buyers’ radar.
WTI 4-Hour chart
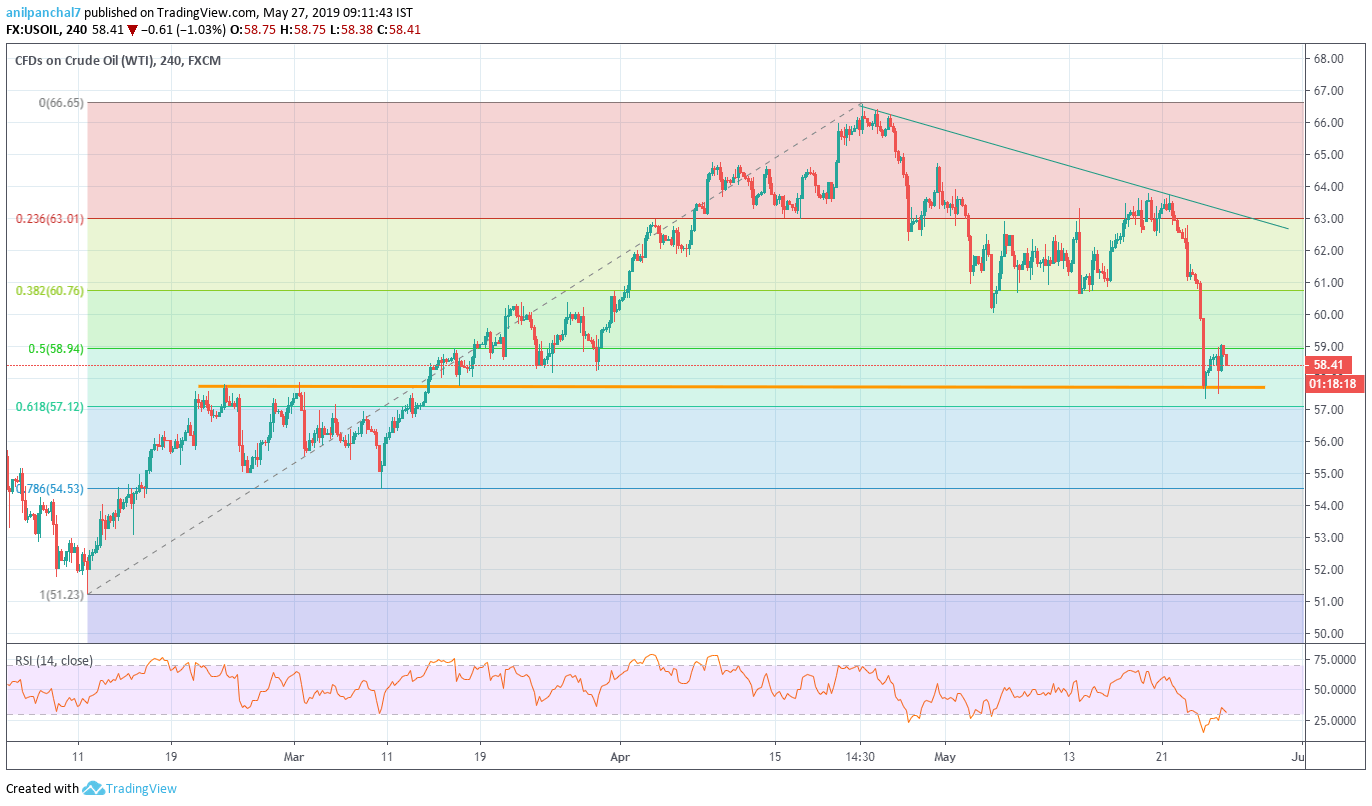
Trend: Bearish
