- WTI extends this week’s retracement slide from near six-week tops.
- Finds decent support near 23.6% Fibo. level, around $54.00 mark.
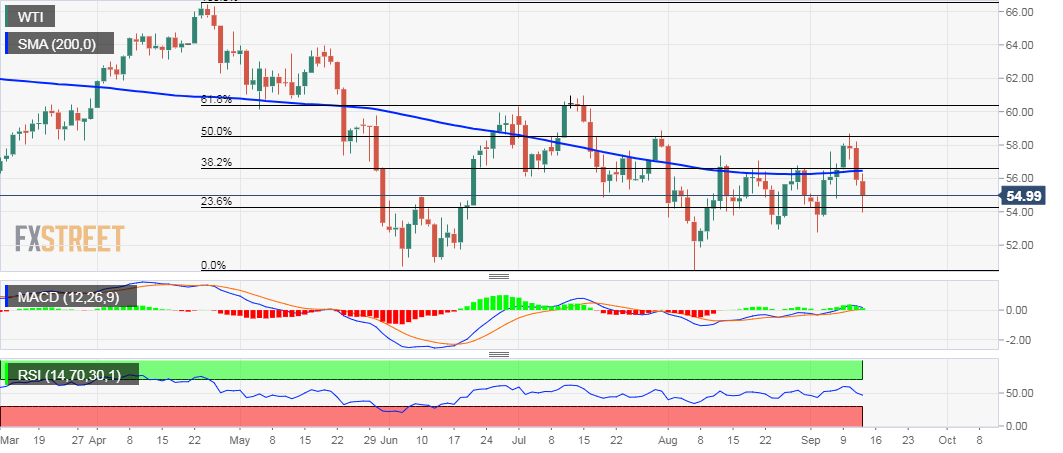
Having climbed to near six-week tops earlier this week, WTI started retreating from a resistance marked by 50% Fibonacci level of the 66.57-50.51 downfall. Despite the fact that OPEC agreed to cut its output, Oil prices witnessed some follow-through selling on Thursday and added to the previous session’s heavy losses.
The intraday rejection slide from the very important 200-day SMA momentarily dragged the black gold below the $54.00/barrel mark for the first time in over a week. The mentioned handle marks 23.6% Fibo. level support and should now act as a key pivotal point for the commodity’s next leg of a directional move.
Meanwhile, technical indicators on the daily charts have been losing positive momentum but are yet to gather bearish traction. Hence, it will be prudent to wait for a sustained break below the mentioned support before positioning for a further near-term slide back towards challenging the $53.00/barrel mark.
The downward trajectory could further get extended towards $52.50 horizontal support, which if broken will expose August swing lows – around mid-$50.00s – with some intermediate support near the $52.00 and $51.00 round figure marks.
WTI daily chart