The Australian dollar was down sharply against its US counterpart, dropping almost 300 pips last week. The upcoming week is a quiet one, with three economic indicators, and the markets watching to see if the impressive run by the US dollar continues. Here is an outlook for the Australian events, and an updated technical analysis for AUD/USD.
Australia’s GDP rose 1 percent in the third quarter, which was higher than the markets had anticipated. The areas of strongest growth were consumer spending and investment in the mining sector. With the cheery economic news, a third consecutive interest rate cut in February by the central bank appears less likely. The US rallied against the Aussie last week, as the greenback continues to benefit from the crippling eurozone debt crisis.
Updates: Australia’s CB Leading Index rose by 0.6%, and meeting minutes showed that the RBA is not expected to cut the rates so fast. This helped the Aussie recover from the lows of under 0.99 and tackle parity once again. The Aussie made a move above 1.02 but lost it quickly as hope left Europe again. AUD/USD is around 1.01. The Aussie climbed above 1.01 and remains stable overcoming a disappointment in New Zealand’s GDP figure. Towards Christmas, AUD/USD stabilizes around 1.0150, capped by 1.02.
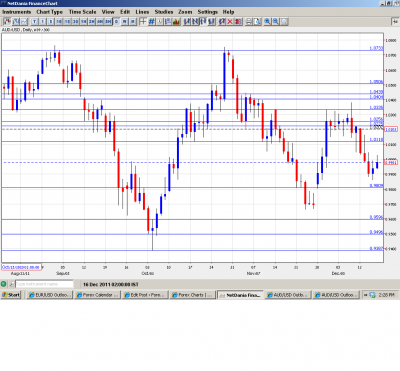
AUD/USD graph with support and resistance lines on it. Click to enlarge:
- CB Leading Index: Monday, 23:00. This Conference Board composite index is based on seven important economic indicators. November’s reading of 0.1% brought a cheer from the markets for two reasons. First, the index rose into positive territory for the first time since June. Second, the reading was significantly better than the market forecast of -0.2%. Will the index stay in positive territory this month as well?
- Monetary Policy Meeting Minutes: Tuesday, 00:30. This monthly report provides a record of the central bank’s most recent meeting. Analysts and traders carefully look at the bank’s views on economic conditions and interest rate policy. A report that is more hawkish than anticipated by the markets is bullish for the Aussie.
- MI Leading Index: Tuesday, 23:30. This important composite index of nine economic indicators was on a roll, with three consecutive positive readings since July. In November, however, the index retracted to -0.3%, stunning the markets,which had predicted a rosy reading of 0.7%. Can the index get back on track and climb into positive territory?
Technical levels from top to bottom:
We begin with the round number of 1.0733, which is strong resistance. Next is the round number of 1.05, which served as support in May and June, and is now in a resistance role. Below is 1.0446, followed by the round number of 1.04, which is a strong level of resistance. The next line of major resistance is 1.0336. Next, the level of 1.0260 is a weak line of resistance. Parity is a weak line as well, as the currency is showing no trouble going above and below this psychological barrier. 0.9810 is now providing weak support to the pair. Strong support for the assie can be seen at 0.9660, as well as the round number of 0.95 – the latter was breached only once in 2011. The final support level for now is at 0.9376.
I am bearish on AUD/USD
The continuing debt crisis in Europe and the global slowdown, particularly in China, are weighing on the Australian dollar. The rally by the greenback against the Aussie this week may be a sign of more to come, if Europe cannot get its act together and the US economy continues to improve.
Further reading:
- For a broad view of all the week’s major events worldwide, read the USD outlook.
- For EUR/USD, check out the Euro to Dollar forecast.
- For the Japanese yen, read the USD/JPY forecast.
- For GBP/USD (cable), look into the British Pound forecast.
- For the Australian dollar (Aussie), check out the AUD to USD forecast.
- For the New Zealand dollar (kiwi), read the NZD forecast.
- For USD/CAD (loonie), check out the Canadian dollar.
