- The USD/JPY pair looks determined to resume its growth after escaping from the ascending channel’s body.
- The second warning line (WL2) could attract the currency pair.
- Its failure to come back to test and retest the uptrend line signalled an upside continuation.
Our USD/JPY forecast sees the pair rallying as the Japanese Yen is punished by the Nikkei’s swing higher. The greenback has continued to appreciate versus the JPY even if the Dollar Index has turned to the downside after the US inflation data release.
Technically, the pair is bullish despite temporary decline. Actually, a minor retreat could help us to catch new long opportunities.
3 Free Crypto Signals Every Week – Full Technical Analysis
In the morning, the Japanese Tertiary Industry Activity registered a 1.7% drop versus only a 0.3% decline expected. Also, yesterday, the JPY received a hit from the Revised Industrial Production. The economic indicator dropped by 3.6% more compared to the 3.2% drop expected.
The USD/JPY could extend its growth after the United States retail sales data have come in better than expected. The Retail Sales rose by 0.7% in September beating the 0.2% drop forecasted, while the Core Retail Sales registered a 0.8% growth in the last month versus 0.5% expected.
Still, it remains to see what will really happen as the Prelim UoM Consumer Sentiment was reported lower at 71.4 below 73.5 points expected, while the Empire State Manufacturing Index dropped from 34.3 to 19.8 far below 24.9 points.
USD/JPY Forecast: Price Technical Analysis – Upside Breakout
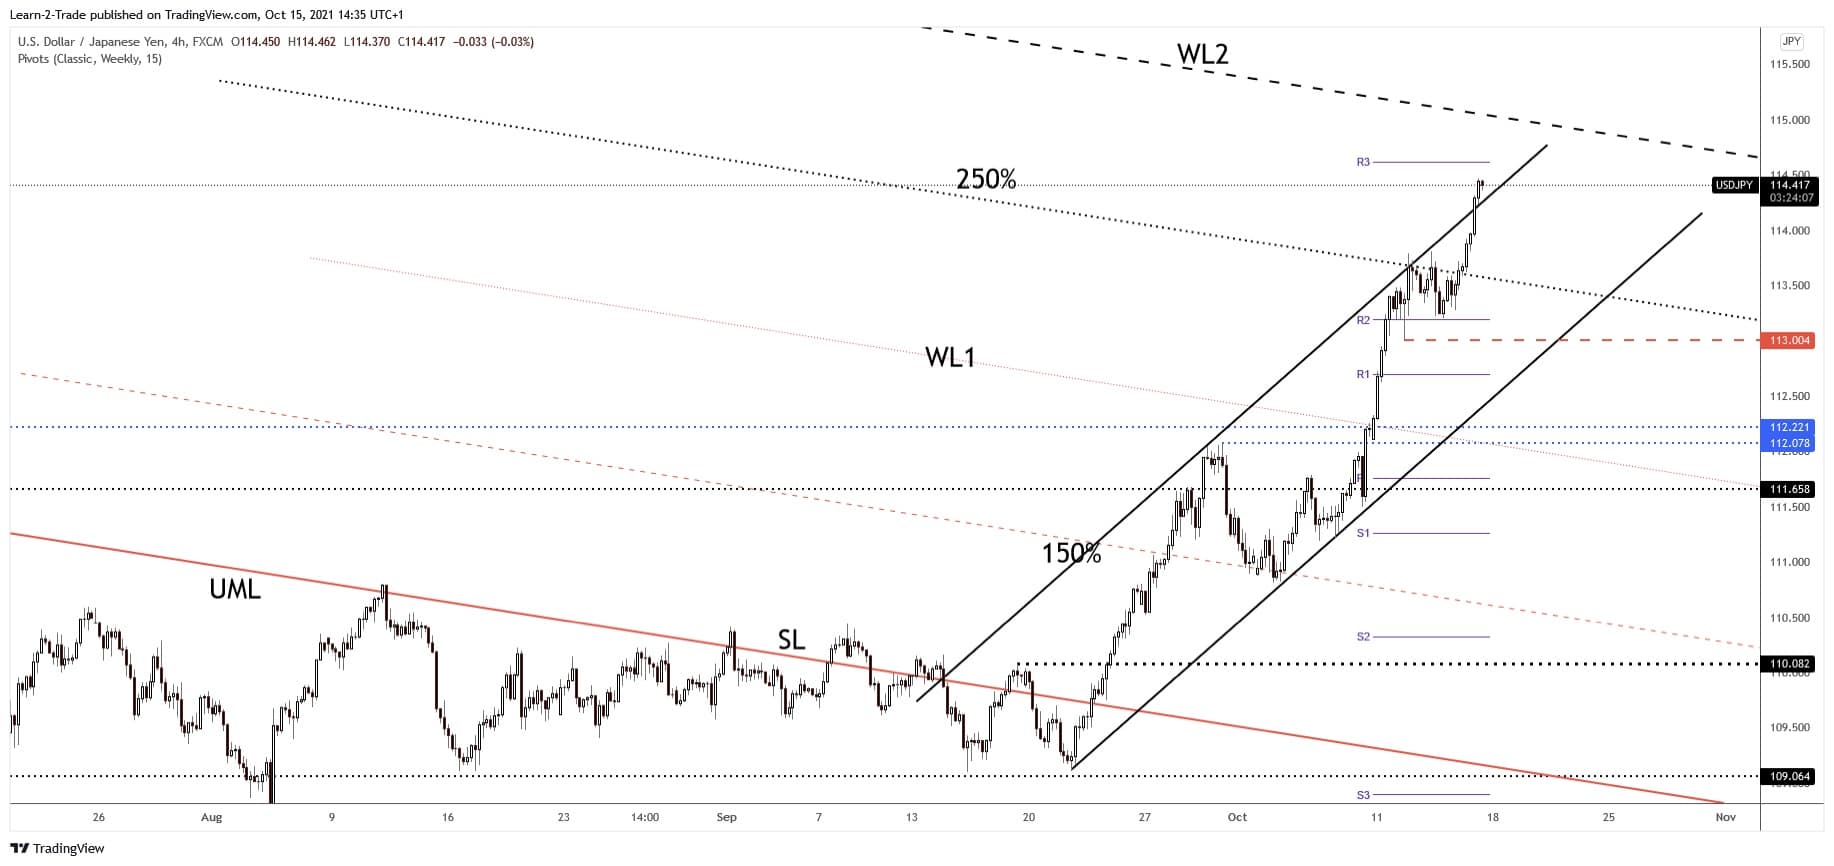
The USD/JPY pair resumed its growth after consolidating above the weekly R2 (113.19). Staying near the 250% Fibonacci line signalled that we may have an upside breakout. As you can see on the h4 chart, the pair moved higher within an ascending channel.
Now, it has escaped from the channel’s body by registering an upside breakout through the channel’s upside line. Confirming its breakout and stabilizing above the broken dynamic resistance may signal an upside continuation.
From the technical point of view, its failure to come back down towards the channel’s downside line signalled strong buyers. The weekly R3 (114.62) stands as a potential upside target, as an obstacle. Also, the second warning line (WL2) of the former major descending pitchfork could attract the price.
Looking to trade forex now? Invest at eToro!
67% of retail investor accounts lose money when trading CFDs with this provider. You should consider whether you can afford to take the high risk of losing your money.
