- The price of Gold is strongly bullish after passing above the inside sliding line (sl).
- XAU/USD could extend its growth if it takes out the near-term resistance levels.
- False breakouts through the immediate obstacles may announce a new sell-off.
Our gold forecast sees the price trading in the green at 1,830.94 below 1,832.61 today’s high. The yellow metal remains bullish and it tries to approach and reach new highs as the Dollar Index remains under strong downside pressure.
DXY’s downside movement helped the XAU/USD to develop the current leg higher. Still, it remains to see what will happen as the price of gold stands below strong upside obstacles.
Also, the Dollar Index could end its correction anytime as the Federal Reserve is expected to take action soon as the inflationary pressure is high.
3 Free Forex Every Week – Full Technical Analysis
Fundamentally, the US is to release its inflation data tomorrow. The volatility could be huge, that’s why you have to be careful, anything could happen. The Consumer Price Index may register a 0.4% growth in January compared to 0.5% growth in December.
In addition, the Core CPI may report a 0.5% growth in the last month compared to 0.6% in the previous reporting period. These are seen as high impact events, XAU/USD could register sharp movements.
Maybe you should keep an eye on the economic calendar as the US Unemployment Claims indicator will be released as well.
If you would like to try automated forex trading then read our guide on how to get started.
Gold Forecast: Price Technical Analysis – Swing Higher
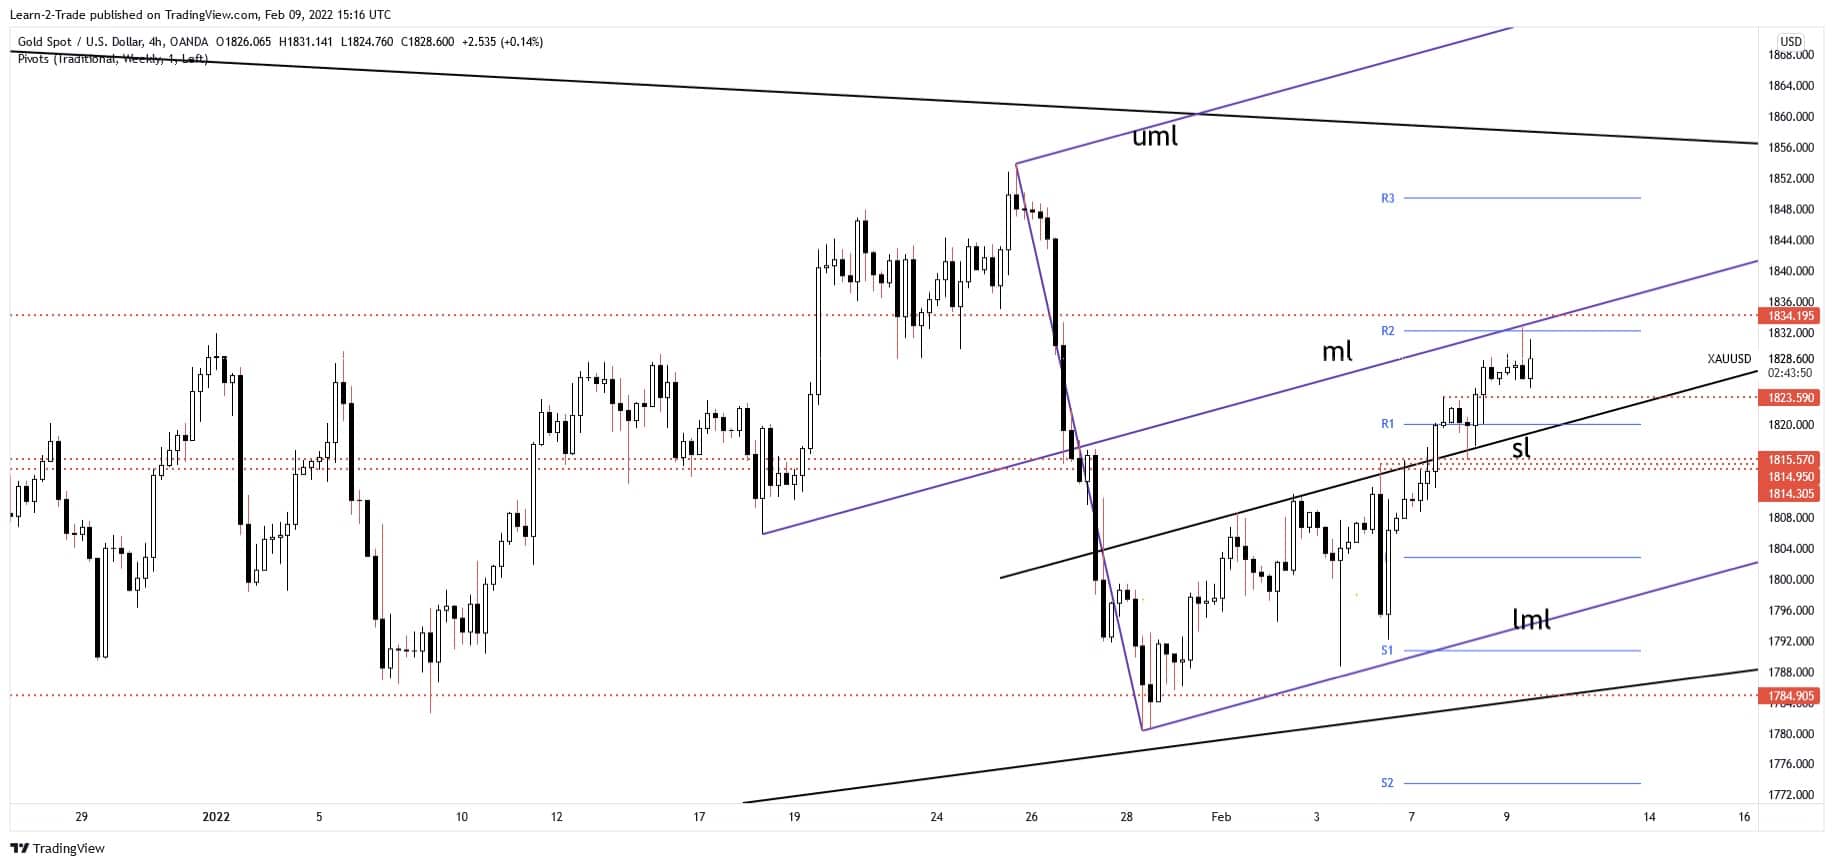
In the short term, Gold is bullish after failing to come back to test and retest the 1,784.90 static support.
After making a valid breakout above the ascending pitchfork’s inside sliding line (sl), XAUUSD was expected to extend its growth. The median line (ml) and the 1,835.19 are seen as upside targets.
A valid breakout above these obstacles may really announce further growth ahead. As you can see, the price registered only a false breakout above the weekly R2 (1,832.20). So, this stands as a static resistance as well.
False breakouts or a major bearish pattern above these near-term resistance levels could announce a new sell-off. In my opinion, as long as it stays above the sliding line (sl), the price of gold could resume its growth despite temporary declines.
Looking to trade forex now? Invest at eToro!
68% of retail investor accounts lose money when trading CFDs with this provider. You should consider whether you can afford to take the high risk of losing your money.
