EURUSD Daily Pivots
| R3 | 1.1214 |
| R2 | 1.1167 |
| R1 | 1.1124 |
| Pivot | 1.1077 |
| S1 | 1.1035 |
| S2 | 1.0988 |
| S3 | 1.0945 |
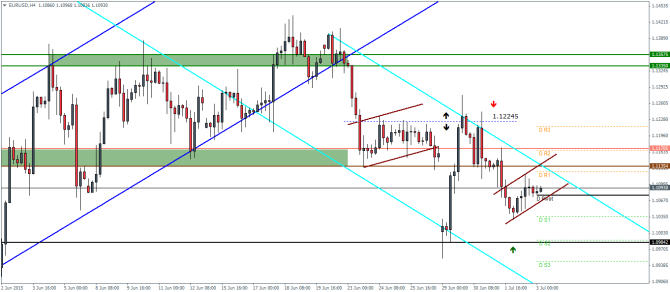
EURUSD (1.109): EURUSD continues to trade within Monday’s range and we expect this range to be broken next week (after the Greece referendum outcome). On the intraday charts, there is a potential bear flag pattern that is taking shape, but one which is yet to be completed. The bear flag puts the potential downside move in EURUSD to 1.09 region ahead of strong support levels at 1.0985 and the most recent low at 1.103. To the upside, there is a likelihood of a test to 1.1135 level of resistance which could be tested.
USDJPY Daily Pivots
| R3 | 124.309 |
| R2 | 124.020 |
| R1 | 123.548 |
| Pivot | 123.247 |
| S1 | 122.775 |
| S2 | 122.473 |
| S3 | 122.001 |
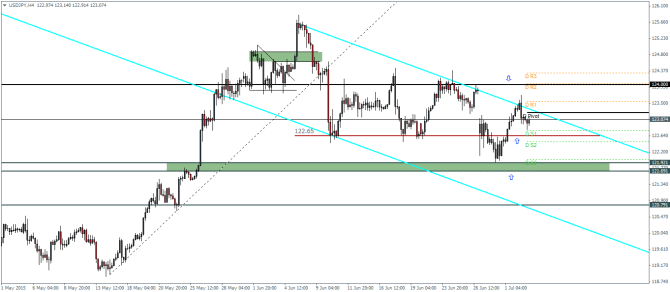
USDJPY (123): USDJPY closed on a bearish reversal note yesterday with a shooting star type of a candlestick pattern on the daily chart. This comes just after the previous day’s bullish engulfing candlestick and is more likely to indicate sideways range trading rather than a decline.
On the intraday charts, we notice that the H4 timeframe shows a bearish engulfing candlestick that formed near the upper channel line of the falling price channel. We can anticipate a dip down to 122.65 which is a minor support level. If price holds here, we could expect a break out to the upside, but it comes with a risk of a decline down to 122.
GBPUSD Daily Pivots
| R3 | 1.5719 |
| R2 | 1.568 |
| R1 | 1.5643 |
| Pivot | 1.5604 |
| S1 | 1.5568 |
| S2 | 1.5528 |
| S3 | 1.5492 |
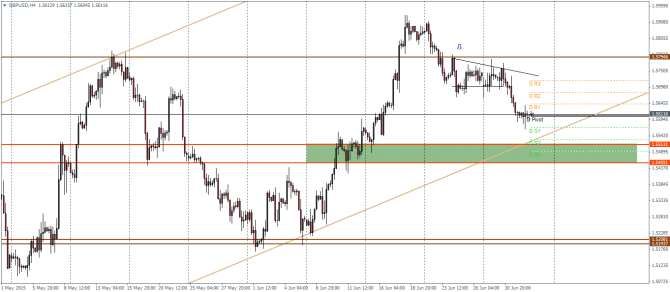
GBPUSD (1.561): GBPUSD looks to have slowed down in its decline with a small bodied candlestick formed yesterday. We could therefore expect a minor retracement to this decline. On the intraday charts, the most probably retracement could be the broken support near 1.57 region. GBPUSD is still biased to the downside and we expect a test to 1.551 in the near term. With price still trading within the rising price channel, GBPUSD could see a bounce off the support at 1.551 to the upside and remains biased until price breaks off the rising price channel.
