EURUSD Daily Pivots
| R3 | 1.1354 |
| R2 | 1.1298 |
| R1 | 1.1222 |
| Pivot | 1.1166 |
| S1 | 1.1090 |
| S2 | 1.1033 |
| S3 | 1.0956 |
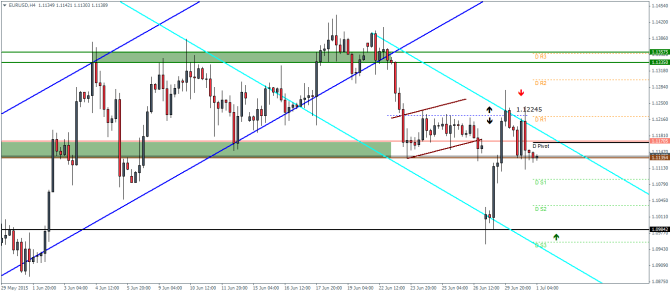
EURUSD (1.113): EURUSD saw a bearish close yesterday but the range remained within Monday’s high and low. As noted yesterday, this range play could be seen until Thursday’s NFP release. On the H4 charts, price attempted to break above 1.12245 yesterday but failed with price being rejected here which saw a decline to the support at 1.1135.
Considering the strong consolidation at this level, EURUSD could potentially look to decline lower to retest 1.095 level of support. This view is supported by the fact that price is still trading within the falling price channel and a dip to 1.095 is needed in order to expect a break out from the falling price channel.
USDJPY Daily Pivots
| R3 | 123.613 |
| R2 | 123.17 |
| R1 | 122.824 |
| Pivot | 122.381 |
| S1 | 122.048 |
| S2 | 121.592 |
| S3 | 121.259 |
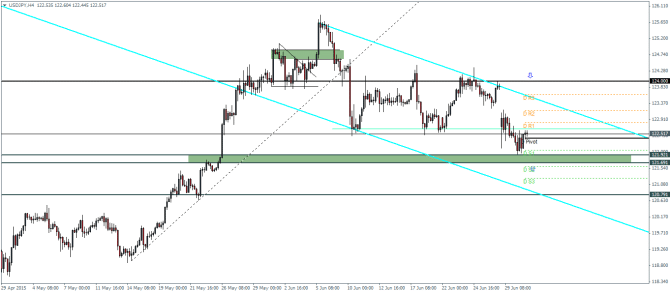
USDJPY (122.54): USDJPY continues to consolidate since Monday’s price action but the price is well supported above 122 – 121.7 level of support. We expect this level to continue to support prices pointing to a potential break to the upside. As noted, the strong bull flag could be validated upon break out with the first upside resistance coming in at 124 followed by 125. In the event the support at 122 – 121.7 fails, USDJPY could see a decline to 120.8 and would in effect invalidate the bull flag.
GBPUSD Daily Pivots
| R3 | 1.5844 |
| R2 | 1.581 |
| R1 | 1.5761 |
| Pivot | 1.5726 |
| S1 | 1.5677 |
| S2 | 1.5643 |
| S3 | 1.5594 |
GBPUSD (1.569): GBPUSD has now been in a sideways range for the past five sessions on the daily chart. On the H4 charts, the bearish pennant pattern looks imminent for a break out to the downside should 1.57 support give way. We expect the downside break out to drip to 1.551 – 1.5455 region. As long as price is within the larger rising price channel, GBPUSD remains biased to the upside, but it could change should price break free from the rising price channel which could then see a decline to the next support at 1.52.
