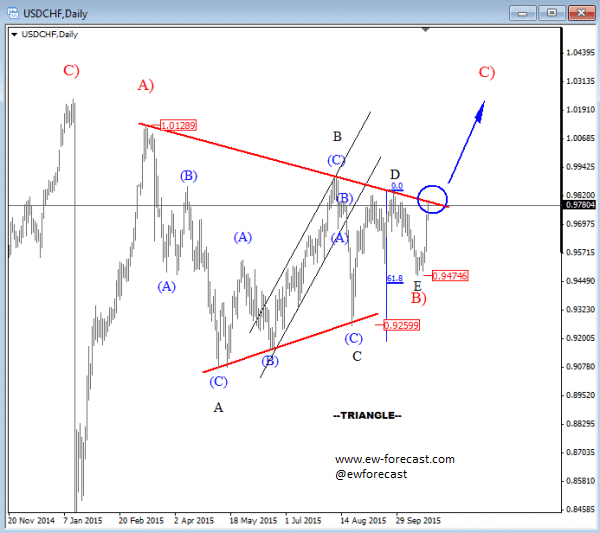
USDCHF has been moving sideways since the end of March. We see five price swings between two trend lines that reminds us of a triangle formation. That’s a five wave A-B-C-D-E pattern that occurs in the direction of a trend, so it’s a continuation formation that suggests more upside for the USDCHF. In fact, this bullish trend continuation may resume very soon after a recent bounce from 0.9470 and towards the upper resistance line. The move from the last few days is sharp, so a break above the trend line may not be far away, which will confirm a bullish run for the USD against the Swiss Franc. We see 1.0000 coming, or even 1.0300-1.0400 in the months ahead.
USDCHF, Daily
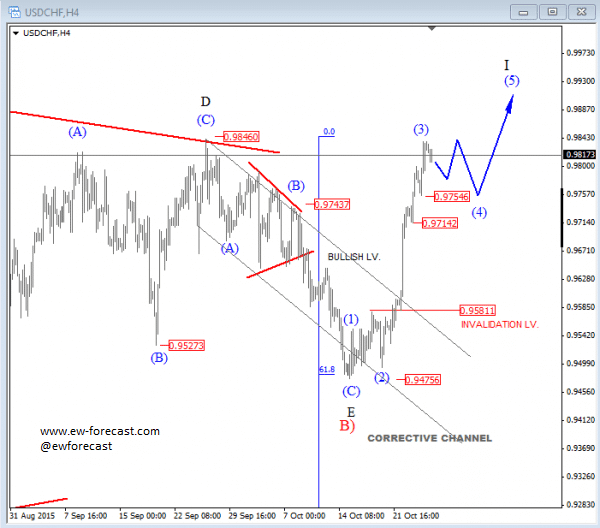
On the 4h chart, USDCHF has finally broken to the upside, emerging from a downward channel, lifting prices up to 0.9740 as expected. We see a current leg as wave (3) of a new bullish impulse so more gains should follow ahead, especially after a wave four pullback which can take place in the next few sessions. Supports are seen at 0.9755 and 0.9715.
USDCHF, 4H
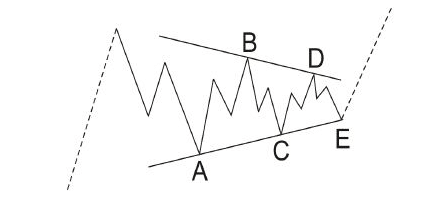
A Triangle is a common 5 wave pattern labeled A-B-C-D-E that moves counter-trend and is corrective in nature. Triangles move within two channel lines drawn from waves A to C, and from waves B to D. Triangles are overlapping five wave affairs that subdivide into 3-3-3-3-3.
Basic Triangle Pattern: