EURUSD Daily Analysis
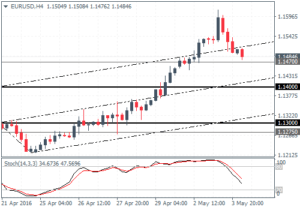
EURUSD (1.14): EURUSD tested the $1.160 handle yesterday but closed on a bearish note settling at 1.1496, indicating a near-term pullback to the upside. Support at 1.147 remains the immediate level of interest, a break below which could see EURUSD extend its declines to 1.130. The bearish divergence on the daily chart points to a deeper pullback that will see EURUSD test the 1.10 handle over the next few weeks.
USDJPY Daily Analysis
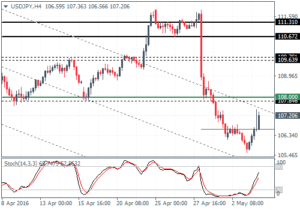
USDJPY (107.2): USDJPY closed yesterday on a modestly bullish note, pulling back from the lows of 105.550. A continued upside momentum could see the recovery push USDJPY towards 110.67 in the near term which marks a strong resistance level that was previously supporting prices. A break above 110.67 could see further bullish momentum in USDJPY for a test to 117 – 116.21 resistance. Minor support at 106.565 is likely to be tested ahead of further gains to the upside. However, a break below this support could see USDJPY either continue to consolidate below the support and the recent lows or extend declines lower.
GBPUSD Daily Analysis
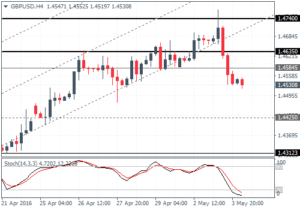
GBPUSD (1.45): GBPUSD closed in a bearish engulfing pattern on the daily chart after a brief test to the resistance high near 1.4743. Engulfing the past two sessions, the downside momentum could see GBPUSD test the lower support at 1.4425. As long as this support holds, which was the resistance neckline of the inverse head and shoulders patterns, GBPUSD is poised to the upside with further gains likely only on a break above the current resistance near 1.4743 – 1.4635. Below the support at 1.4425, GBPUSD could slip towards 1.4312 – 1.430 support.
Gold Daily Analysis
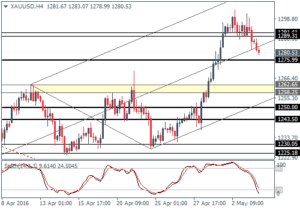
XAUUSD (1280.5): Gold prices are into their second day of declines following the doji pattern that was formed at the top end of the rally to $1300. The downside could see Gold prices slip to 1275 support, but overall, gold remains well positioned to the upside above the 1200 handle. On the 4-hour chart, looking at the Stochastics, there is scope for 1275 – 1276 support likely to offer a short term bounce, but the upside is likely to be limited to the currently broken support at 1291 – 1289 which could be tested for resistance.
