EURUSD Daily Analysis
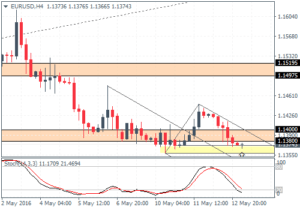
EURUSD (1.13): EURUSD formed an inside bar yesterday and on the 4-hour chart, we notice prices slipping back to the support. The euro sits near a critical price level of 1.13716 where a daily close below this level could see the support level give way and open the euro for further declines to 1.12170. Alternately, should price managed to turn bullish above 1.13716, the expected bullish move should see prices test 1.14975 resistance.
USDJPY Daily Analysis
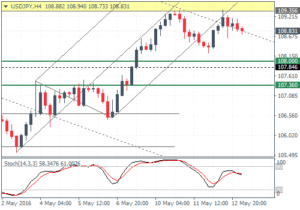
USDJPY (108.8): USDJPY was bullish but failed to post any highs. With the expected retest to 107.955 support anticipated, any further upside moves are unlikely in the near term. On the 4-hour chart, following the break of the rising median line and a retest to the resistance at 109.356, the Stochastics also confirms a bearish divergence indicating a short-term correction to 108 through 107.360 region of support. The bullish bias remains intact as long as USDJPY does not break below this lower support.
GBPUSD Daily Analysis
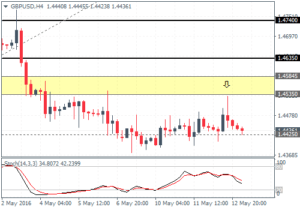
GBPUSD (1.44): GBPUSD closed with a doji pattern yesterday and marks a fourth consecutive day of price action consolidating near 1.4425 support. The bias remains mixed for the moment and price action could move in either direction. On the 4-hour chart, the ranging price action is more evidenced with prices turning flat near 1.4425 while an attempt to test the resistance at 1.4535 was rejected. The British pound is, however, likely to consolidate in the near term as we expect a more firm test of resistance at 1.4535.
Gold Daily Analysis
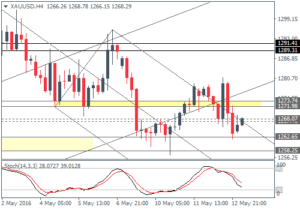
XAUUSD (1268): Gold reversed the previous day’s gains yesterday and closed on a bearish note at 1263 after rising to 1281 highs. The daily chart shows gold sitting near the dynamic support off the lower median line and could still rise to the 1290 levels. Confirming this view, the 4-hour chart has currently printed a higher low near 1262 and a follow through from here could see a test to 1290. However, price action will likely struggle near the minor resistance of 1271 – 1273. To the downside, a daily close below 1258 could invalidate any bullish bets.
