EURUSD Daily Analysis
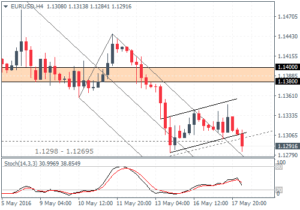
EURUSD (1.129): EURUSD closed with another small bodied candlestick pattern yesterday trading within a range for the second consecutive session. Price action is again looking to test the 1.130 support level, and a daily close to the downside could accelerate the declines to 1.120 and to lower support levels. On the 4-hour chart, we see a possible bearish flag pattern forming with prices currently looking to breakout lower. A confirmed move here could see EURUSD slip towards 1.1217 support. However, if the bearish flag pattern fails, this could see an accelerated rally towards 1.1138 resistance.
USDJPY Daily Analysis
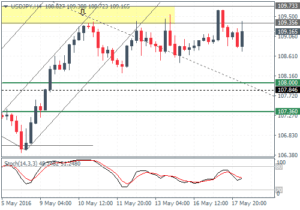
USDJPY (109.10): USDJPY closed in a small bodied candlestick pattern yesterday, but no significant moves yet from the range. Price action was seen testing the 109.73 – 109.35 resistance level again but with little success. The continued consolidation seen here could infer an impending breakout in the near term. Support at 108 – 107.85 will be the first level to watch for, following a move to 107.36 levels. The downside at the moment looks very strong but in the near term, USDJPY remains range bound within these said levels.
GBPUSD Daily Analysis
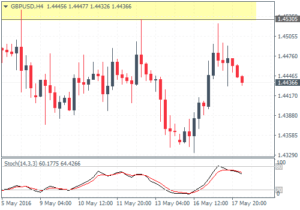
GBPUSD (1.443): GBPUSD attempted to close on a bullish note yesterday but the failure to clear the recent doji pattern’s high is a sign of caution. Prices remain consolidating near 1.4425 levels with the upside capped near 1.4635 – 1.460 resistance levels. The Stochastics on the daily chart has moved into oversold levels, which could signal a modest break higher. On the 4-hour chart price action tested the 1.453 resistance but again this was met with a strong rejection. Overall, GBPUSD remains range bound within 1.453 resistance and 1.431 support.
Gold Daily Analysis
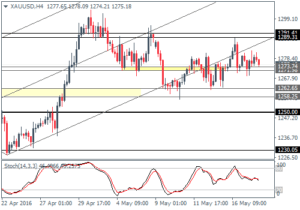
XAUUSD (1275): Gold prices attempted to close bullish yesterday following the previous day’s doji pattern. Price action in gold remains flat at the moment, but the daily chart shows prices the dynamic support of the 20 days EMA and the lower median line. On the 4-hour chart, gold is supported above 1273 – 1271 and could remain range bound above this levels, but a risk of a breakdown of the support could see gold slip towards 1262.65 – 1258.25 levels.
