EURUSD Daily Analysis
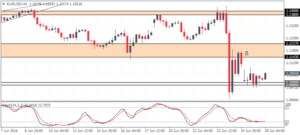
EURUSD (1.105): EURUSD formed a spinning bottom yesterday seeking support at 1.10 with the price action seeing a bullish follow through in early Asian trading today. The gains came after markets started pricing a Fed rate cut this year following the Brexit verdict. The Fed funds futures rate is now surprisingly pricing in a 17% rate cut by September, increasing from 7% on Friday. From a technical perspective, the euro has managed to establish support near 1.10 – 1.0985 support level and in the interim, price action remains caught above this support and below 1.1143 – 1.115 resistance levels.
USDJPY Daily Analysis
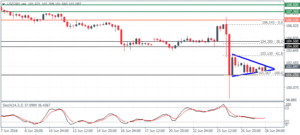
USDJPY (102.09): USDJPY also closed in a modestly bullish note yesterday with price seen to be stabilizing above 101.250 support. However, the 4-hour chart’s bearish pennant pattern remains in play keeping the downside bias intact. The view shifts only in the event of a breakout above 103.130, in which case, USDJPY could be looking to move sideways below 104.50 – 105, but the further upside could be seen on a break above this resistance level.
GBPUSD Daily Analysis
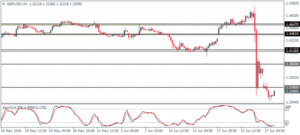
GBPUSD (1.330): GBPUSD extended its declines yesterday and closed below Friday’s lows to settle at 1.3224. Price action is currently attempting to move higher, but the upside is limited to the unfilled gap from Friday’s close at 1.3677. On the 4-hour chart, resistance is seen at 1.3385, and further upside is likely only on a break out above this resistance. To the downside, with the lows being established, GBPUSD could remain limited in its declines for now.
Gold Daily Analysis
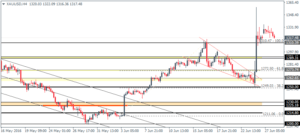
XAUUSD (1317.48): Gold prices are retreating after price action yesterday was largely flat resulting in a doji pattern. A bearish follow through today could see gold prices slide towards the 1300 – 1290 levels of support which previously acted as resistance prior to the breakout. The same view is seen on the 4-hour chart and increases the likelihood of gold prices sliding to the 1310 minor support initially. A close below 1310 – 1305 on the 4-hour time frame could extend gold’s declines to 1290 and could limit the upside bias formed from the bullish pennant pattern.
