EURUSD Daily Analysis
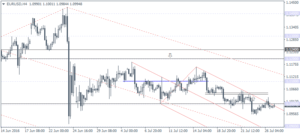
EURUSD (1.099): The EURUSD is seen hovering near 1.10, for nearly 6 days so far, but that could change heading into today’s trading session. 1.10 remains a near term resistance level on the 4-hour chart and subject to a breakout above 1.10; further upside can be expected. Overall, EURUSD remains range bound within 1.110 and 1.10 ahead of the FOMC meeting today. A break above 1.11 will signal further upside towards 1.120 which will mark a completion of the bullish divergence seen on the daily chart and the Stochastics. To the downside, look for initial resistance at 1.10 to hold following a break below the previous low established at 1.0951.
USDJPY Daily Analysis
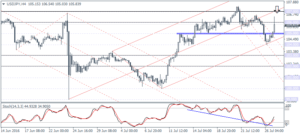
USDJPY (105.84): USDJPY is seen testing 106 levels this morning, but we expect the declines to resume shortly as the lower support at 103.0 – 103.5 remain untested. Price action also shows the hidden bearish divergence on the daily time frame indicating that USDJPY will be looking weaker in the near term towards 103.0 – 103.5. To the upside, only a breakout above 108 could signal further upside. For the moment, price action will likely remain flat within 106 and 105 levels.
GBPUSD Daily Analysis
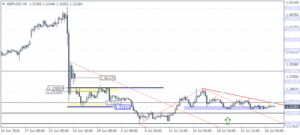
GBPUSD (1.312): GBPUSD has been flat for the past two days, trading below 1.320. With the advance Q2 GDP due out today, the Sterling might get the much required push. Price remains flat bouncing off the 1.311 – 1.308 support level which marks the minor head and shoulders on the 4-hour chart. A break below this support could send GBPUSD testing 1.280 – 1.285 lows. Further declines can be expected only on a conclusive break down of prices below 1.28, failing which GBPUSD is likely to remain range bound.
Gold Daily Analysis
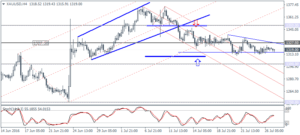
XAUUSD (1319.00): Gold is seen testing 1318 – 1315 support level with the daily chart showing a hidden bullish divergence currently near this support level. The upside is, therefore, likely to unfold if gold can breakout above 1327.50 resistance level. On the 4-hour chart, price action is evolving into a descending triangle pattern with the support identified near 1315.30 – 1309.50. A break out below this support could signal a dip to 1300 which could limit the declines initially followed by a move lower towards 1250.
