EURUSD Daily Analysis
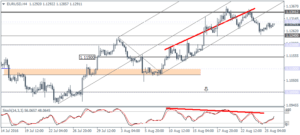
EURUSD (1.1291): EURUSD is currently attempting to retest the price zone near 1.1300 with prices trading within Thursday’s range of high and low forming an inside bar. A potential breakout from here is quite likely as a result. On the 4-hour chart, after prices broke down from the rising median line, we see a retracement back to the breakout level which comes in near 1.1300. While the bearish divergence remains in play, the correction in EURUSD remains short lived as a retest to 1.1200 remains on the cards.
USDJPY Daily Analysis
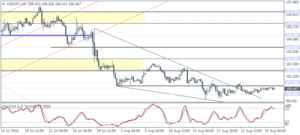
USDJPY (100.46): USDJPY remains flat for another day, but this could soon be changing. The price zone near 100.50 – 100.00 remains of immediate interest which could give way for the price to test 102.00 which forms the initial resistance level. The re-adjusted pattern on the 4-hour time frame shows the descending triangle which has broken to the upside, but being capped near 100.50 – 100.00. To the downside, a daily close below 100.00 could invalidate this pattern and expose USDJPY to further downside.
GBPUSD Daily Analysis
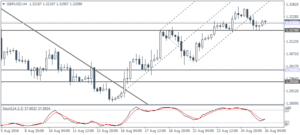
GBPUSD (1.3209): GBPUSD is trading near the 1.3200 with the daily Stochastics showing a hidden bearish divergence on the lower high in prices and a higher high on the oscillator. This hints to a potential downside in GBPUSD towards 1.3000. On the 4-hour chart, GBPUSD failed to build on its gains above 1.3200 – 1.31700 and with price breakout from the rising median line, we can expect to see a break down towards 1.3000 – 1.2950 in the event that the resistance gives way. Watch for a potential lower high above 1.3200 for initial clues ahead of the dip to 1.3000.
Gold Daily Analysis
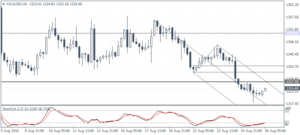
XAUUSD (1324.60): Gold prices fell to 1322 region yesterday after the hourly chart shows a break down in the descending triangle pattern. The declines marked a completion to 161.8% of the measured move, and the current pullback could see a retest of the broken support near 1335 – 1332. On the 4-hour chart, 1327.50 which previously served as support could now be tested for resistance. However, expect further upside to 1335 – 1332 if price forms a higher low. The correction is likely to stall near this level ahead of further declines to 1300.00.
