EUR/USD remains in the same old range after Draghi’s dovish twist, but the technical picture has turned against it.
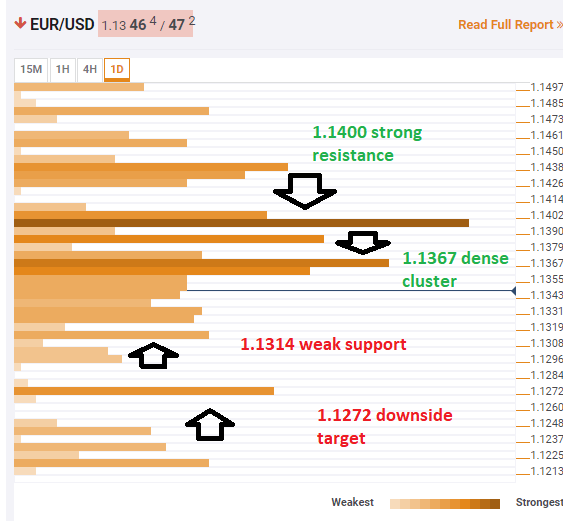
The Technical Confluences Indicator shows that euro/dollar faces an uphill battle around 1.1367with the Bollinger Band 1h-Middle, the Simple Moving Average 100-1h, the SMA 5-4h, the SMA 100-15m, the SMA 200-4h, the BB one-day-Middle, the BB 15 min Upper, the Fibonacci 38.2% one-day, the SMA 10-15m, and quite a few additional technical lines.
If the pair manages to overcome that hurdle, it faces fierce resistance at 1.1400 which is the confluence of the potent Fibonacci 38.2% one-month, the previous one-day high, the Pivot Point one-day Resistance 1, the Fibonacci 23.6% one-week, and the BB 4h-Upper.
Looking down, EUR/USD has some support at 1.1314 where we see the previous weekly low and the Bollinger Band 4h-Lower.
More significant support is only at 1.1272 which is the meeting point of the Pivot Point one-week Support 2, and the PP one-week Support 3.
All in all, the path of least is resistance is to the downside.
Here is how it looks on the tool:
Confluence Detector
The Confluence Detector finds exciting opportunities using Technical Confluences. The TC is a tool to locate and point out those price levels where there is a congestion of indicators, moving averages, Fibonacci levels, Pivot Points, etc. Knowing where these congestion points are located is very useful for the trader, and can be used as a basis for different strategies.
This tool assigns a certain amount of “weight” to each indicator, and this “weight” can influence adjacents price levels. These weightings mean that one price level without any indicator or moving average but under the influence of two “strongly weighted” levels accumulate more resistance than their neighbors. In these cases, the tool signals resistance in apparently empty areas.
