EUR/USD is settling above 1.1200 and looking for a new direction as markets focus on the upcoming Fed decision. And while ranges could be limited for a while, it may go quite wild later on. The path of least resistance is up.
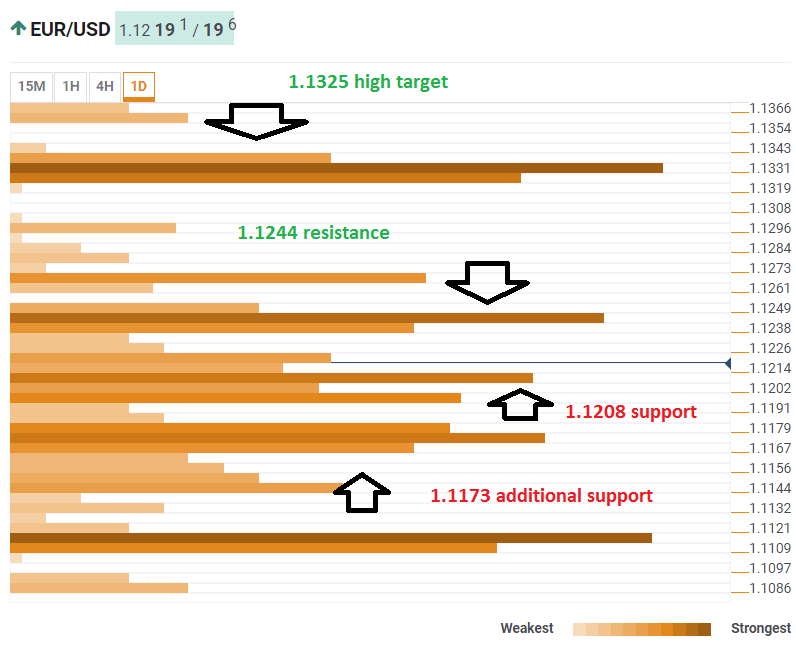
The Technical Confluences Indicator shows that the pair faces substantial resistance at 1.1244 which is the convergence of the Pivot Point one’day Resistance 1, the PP 1w-R1, the Simple Moving Average 100-4h, and the Bollinger Band 1d-Middle.
If it manages to break higher, it could run all the way to around 1.1325 where we see several significant resistance lines converge. These include the previous monthly high, the Pivot Point one-week R2, the PP 1m-R1, the BB 1d-Upper, and the SMA 100-1d.
Support is quite close. At 1.1208 we see the meeting point of the BB 1h-Lower, the Fibonacci 61.8% one-week, the Fibonacci 61.8% one-day, the SMA 200-1h, and the SMA 10-4h.
Further down, 1.1173 is a more considerable cushion. IT includes the SMA 100-1h, the SMA 5-1d, the Fibonacci 38.2% one-week, BB 4h-Middle, and more.
Here is how it looks on the tool:
Confluence Detector
The Confluence Detector finds exciting opportunities using Technical Confluences. The TC is a tool to locate and point out those price levels where there is a congestion of indicators, moving averages, Fibonacci levels, Pivot Points, etc. Knowing where these congestion points are located is very useful for the trader, and can be used as a basis for different strategies.
This tool assigns a certain amount of “weight” to each indicator, and this “weight” can influence adjacents price levels. These weightings mean that one price level without any indicator or moving average but under the influence of two “strongly weighted” levels accumulate more resistance than their neighbors. In these cases, the tool signals resistance in apparently empty areas.
