GBP/USD is trading higher, extending its recovery amid mixed EU election results. The Brexit party and the pro-Remain parties gained a similar number of votes. Where next?
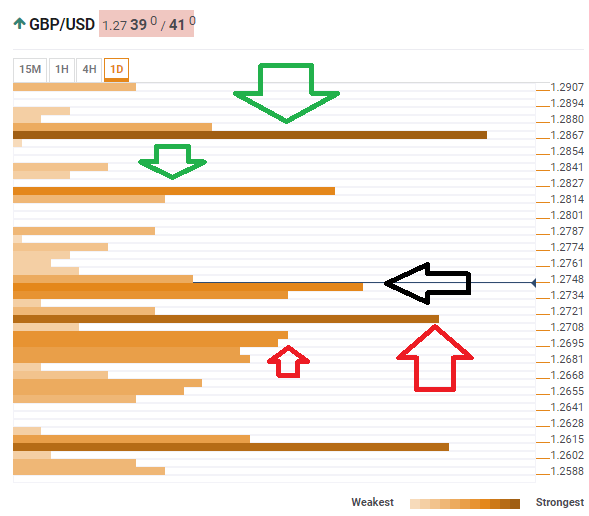
The Technical Confluences Indicator shows that cable is struggling with 1.2741 which is the convergence of the Fibonacci 61.8% one-week, the previous 4h-high, the Bollinger Band 4h-Upper, and the Simple Moving Average 10-15m.
Looking up, the first noteworthy cluster of resistance lines awaits at 1.2820where the previous weekly high and the Pivot Point one-week Resistance 1 meet.
The upside target is 1.2867 which is the confluence of the previous month’s low and the Pivot Point one-month Support 1.
Support awaits at 1.2715 which is a dense cluster including the BB 1h-Middle, the Fibonacci 23.6% one-day, and the previous 4h-low.
Additional support is at 1.2695 which is the meeting point of the SMA 10-4h and the SMA 5-1d.
This is how it looks on the tool:
Confluence Detector
The Confluence Detector finds exciting opportunities using Technical Confluences. The TC is a tool to locate and point out those price levels where there is a congestion of indicators, moving averages, Fibonacci levels, Pivot Points, etc. Knowing where these congestion points are located is very useful for the trader, and can be used as a basis for different strategies.
This tool assigns a certain amount of “weight” to each indicator, and this “weight” can influence adjacents price levels. This means that one price level without any indicator or moving average but under the influence of two “strongly weighted” levels accumulate more resistance than their neighbors. In these cases, the tool signals resistance in apparently empty areas.
