GBP/USD has been on the back foot and hit new two-years lows as concerns about a hard Brexit persist. What levels should we watch?
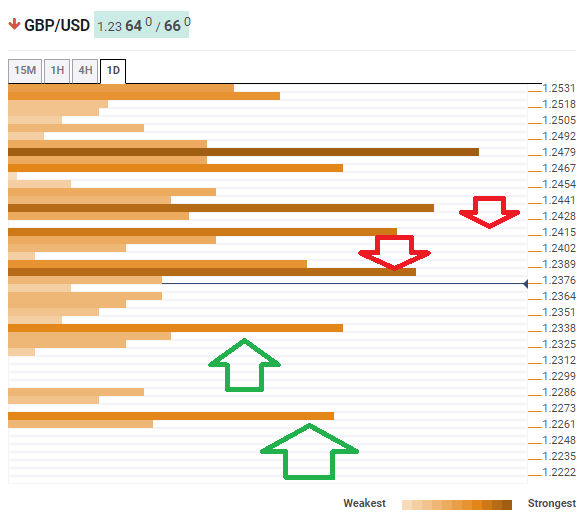
The Technical Confluences Indicator shows that GBP/USD’s next stop to the downside is 1.2338 which is the convergence of the Fibonacci 38.2% one-month, the Pivot Point one-week Support 1, and the Bollinger Band 1h-Lower.
Further down, the next cushion awaits only at 1.2265 which is the meeting point of the PP 1m-S3 and the PP 1d-S3.
Looking up, substantial resistance caps GBP/USD at 1.2382 where we see a dense cluster including the BB 15min-Upper, the BB 1d-Lower, the Simple Moving Average 5-4h, and the previous 4h-high.
Further up, 1.2415 is another considerable resistance cluster – among many – and it includes the Fibonacci 38.2% one-day, the SMA 10-4h, and the Fibonacci 23.6% one-week.
All in all, cable has more room to move to the downside than to the upside.
This is how it looks on the tool:
Confluence Detector
The Confluence Detector finds exciting opportunities using Technical Confluences. The TC is a tool to locate and point out those price levels where there is a congestion of indicators, moving averages, Fibonacci levels, Pivot Points, etc. Knowing where these congestion points are located is very useful for the trader, and can be used as a basis for different strategies.
This tool assigns a certain amount of “weight” to each indicator, and this “weight” can influence adjacents price levels. This means that one price level without any indicator or moving average but under the influence of two “strongly weighted” levels accumulate more resistance than their neighbors. In these cases, the tool signals resistance in apparently empty areas.
