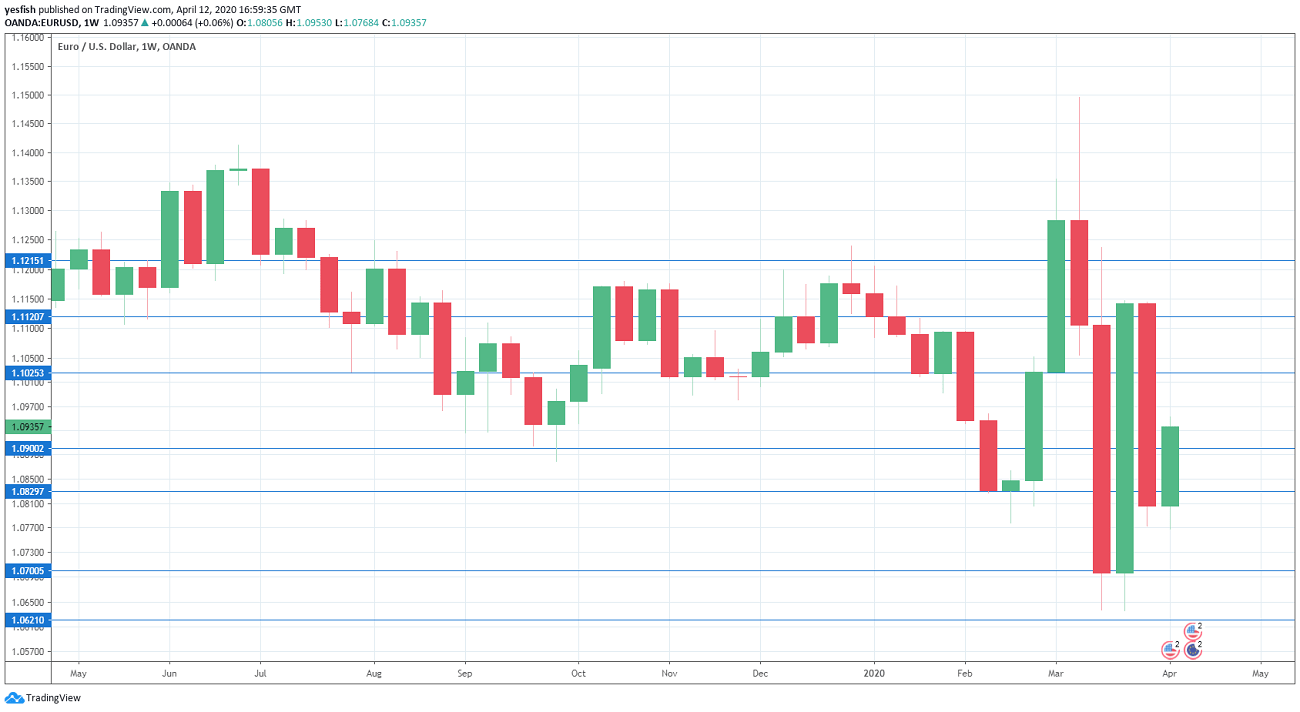
EUR/USD daily chart with support and resistance lines on it. Click to enlarge:
EUR/USD volatility waned last week, as the pair gained 1.2 percent. There are five events in the upcoming week. Here is an outlook at the highlights and an updated technical analysis for EUR/USD.
German industrial numbers were mixed. Factory orders declined by 1.4% in February, after a strong gain of 5.5% a month earlier. Industrial production slowed to 0.3%, but beat the estimate of -0.7 percent. The ECB minutes from the March meeting took note of the turmoil caused by the Corvid-19 outbreak and stated that “the risks surrounding the euro area growth outlook were clearly on the downside”.
In the U.S. employment numbers were miserable, as the COVID-19 virus has paralyzed much of the U.S. economy. Unemployment claims hit a shocking level for a second straight week, hitting 6.60 million. This was higher than the estimate of 5.0 million. The week ended on a sour note, as consumer inflation declined by 0.4% in March, the first decline since December 2018. Core CPI fell by 0.1%, after a gain of 0.2% a month earlier.
- German Final CPI: Thursday, 6:00. The initial March reading for CPI came in at 0.1%, edging above the estimate of 0.0%. The final reading is expected to conform to this figure.
- Eurozone Industrial Production: Thursday, 9:00. The indicator rebounded in January with a gain of 2.3%, after a decline of 2.1% a month earlier. The estimate for February stands at -0.1%.
- Eurozone Inflation: Friday, 9:00. In the initial readings, the headline figure for March came in at 0.7%, while the core figure showed a gain of 1.0%. The final readings are expected to conform to the initial readings.
EUR/USD Technical analysis
Technical lines from top to bottom:
We start with resistance at 1.1215, which has held since mid-January. 1.1119 is next.
1.1025 (mentioned last week) switched to a resistance role last week.
1.0900 is an immediate support level. It could see action early next week.
1.0829 has switched to a support role after gains by EUR/USD last week.
The round number of 1.07 is next.
1.0620 is protecting the 1.06 level. It is the final support level for now.
.
I remain bearish on EUR/USD
The eurozone economy has been hard hit by the Corvid-19 virus, especially Italy and Spain. The dire financial situation could spark a debt crisis, which would likely dampen sentiment towards the euro.
Further reading:
-
- GBP/USD forecast – Pound/dollar predictions
- USD/JPY forecast – analysis for dollar/yen
- AUD/USD forecast – the outlook for the Aussie dollar.
- USD/CAD forecast – Canadian dollar predictions
- Forex weekly forecast – Outlook for the major events of the week
Safe trading!
