The New Zealand dollar had a very bad week, losing a lot of ground. Can it find a bottom now? Trade balance is the main event this week. Here is an outlook for the events moving the kiwi, and an updated technical analysis for NZD/USD.
The FOMC meeting minutes in the US left the notion that QE tapering is still on the table for December. This strengthened the dollar against commodity currencies, and the kiwi was no exception. The RBNZ, which keeps on complaining against the strength of NZD, is probably pleased. This came despite a stronger than expected PPI report in New Zealand: Input PPI rose by 2.2% in Q3, significantly more than expected.
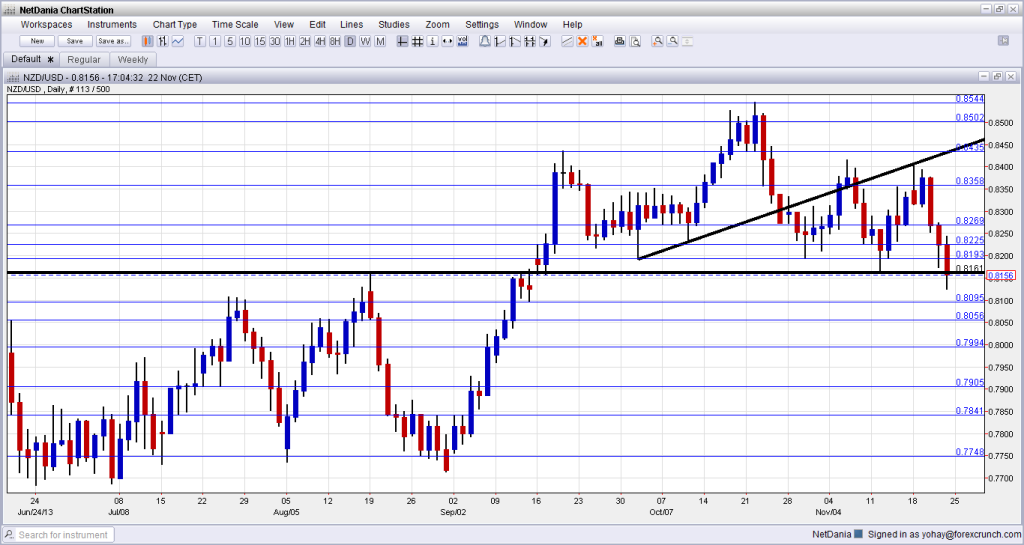
[do action=”autoupdate” tag=”NZDUSDUpdate”/]NZD/USD daily graph with support and resistance lines on it. Click to enlarge:
- Trade Balance: Tuesday, 21:45. New Zealand’s trade balance for September showed a smaller than expected deficit of NZD 199 million. This was the third consecutive month of deficits. For October, the deficit is expected to widen once again and reach 345 million.
- ANZ Business Confidence: Thursday, 00:00. 1500 businesses are surveyed for this important indicator by ANZ. In the release for October, the indicator dropped to 53.2 points. A small rise is likely now.
- Building Consents: Thursday, 21:45. The number of building approvals increased in the past two months, showing a stable and healthy environment. After the 1.4% rise in September, a drop is likely now.
* All times are GMT.
NZD/USD Technical Analysis
NZD/$ began the week trading around the high ground of 0.8360, but it was all downhill from there. A move under the critical 0.8160 line resulted in a quick pullback and the battle remains for the upcoming week.
Technical lines, from top to bottom:
0.8435 was the peak in September – a peak that triggered a big downfall. After it was broken again, the line switched to support. It is a clear separator.
0.8360 worked in both directions at the beginning of the year: in March as resistance and in April as support. Also more recently, it worked as yet another clear separating line. Below, 0.8270 provided some support during October, and it also worked as resistance in March.
0.8225 was an important line in previous years, and also worked as support recently. 0.8160 capped the pair in August and worked as support in March. The round number of 0.81 worked as resistance in July.
Lower, 0.8050 was a peak back in June and works as support before the very round number of 0.80.
Below 0.80, we find another round number: 0.79. This level was a pivotal line several times in the past. 0.7840 worked as resistance when the pair traded in lower ground earlier in the year.
Broken uptrend channel
Since September, NZD/USD traded in an upwards channel, with uptrend resistance having a clearer role than support. As the chart shows, NZD/USD broke below this line. Another attempt to break back didn’t last too long.
I remain bullish on NZD/USD
After a week like this, it is quite hard to be bullish, but the fundamentals are all pointing to this direction. Rising prices, prospects of a rate hike with an already non-zero interest rate, inflows of cash and positive net migration all support the kiwi. Without any projected tapering hints this week, the kiwi could recover.
Further reading:
- For a broad view of all the week’s major events worldwide, read the USD outlook.
- For EUR/USD, check out the Euro to Dollar forecast.
- For the Japanese yen, read the USD/JPY forecast.
- For GBP/USD (cable), look into the British Pound forecast.
- For the Australian dollar (Aussie), check out the AUD to USD forecast.
- For USD/CAD (loonie), check out the Canadian dollar forecast.
