The lack of movement we have been seeing from USD/CAD continued last week, as the pair was almost unchanged, closing at 1.1039. This week has just three releases, highlighted by GDP. Here is an outlook on the major events and an updated technical analysis for USD/CAD.
Canadian Core Retail Sales matched expectations. In the US, employment and housing data disappointed, but manufacturing and consumer confidence numbers looked sharp.
[do action=”autoupdate” tag=”USDCADUpdate”/] USD/CAD daily chart with support and resistance lines on it.Click to enlarge: 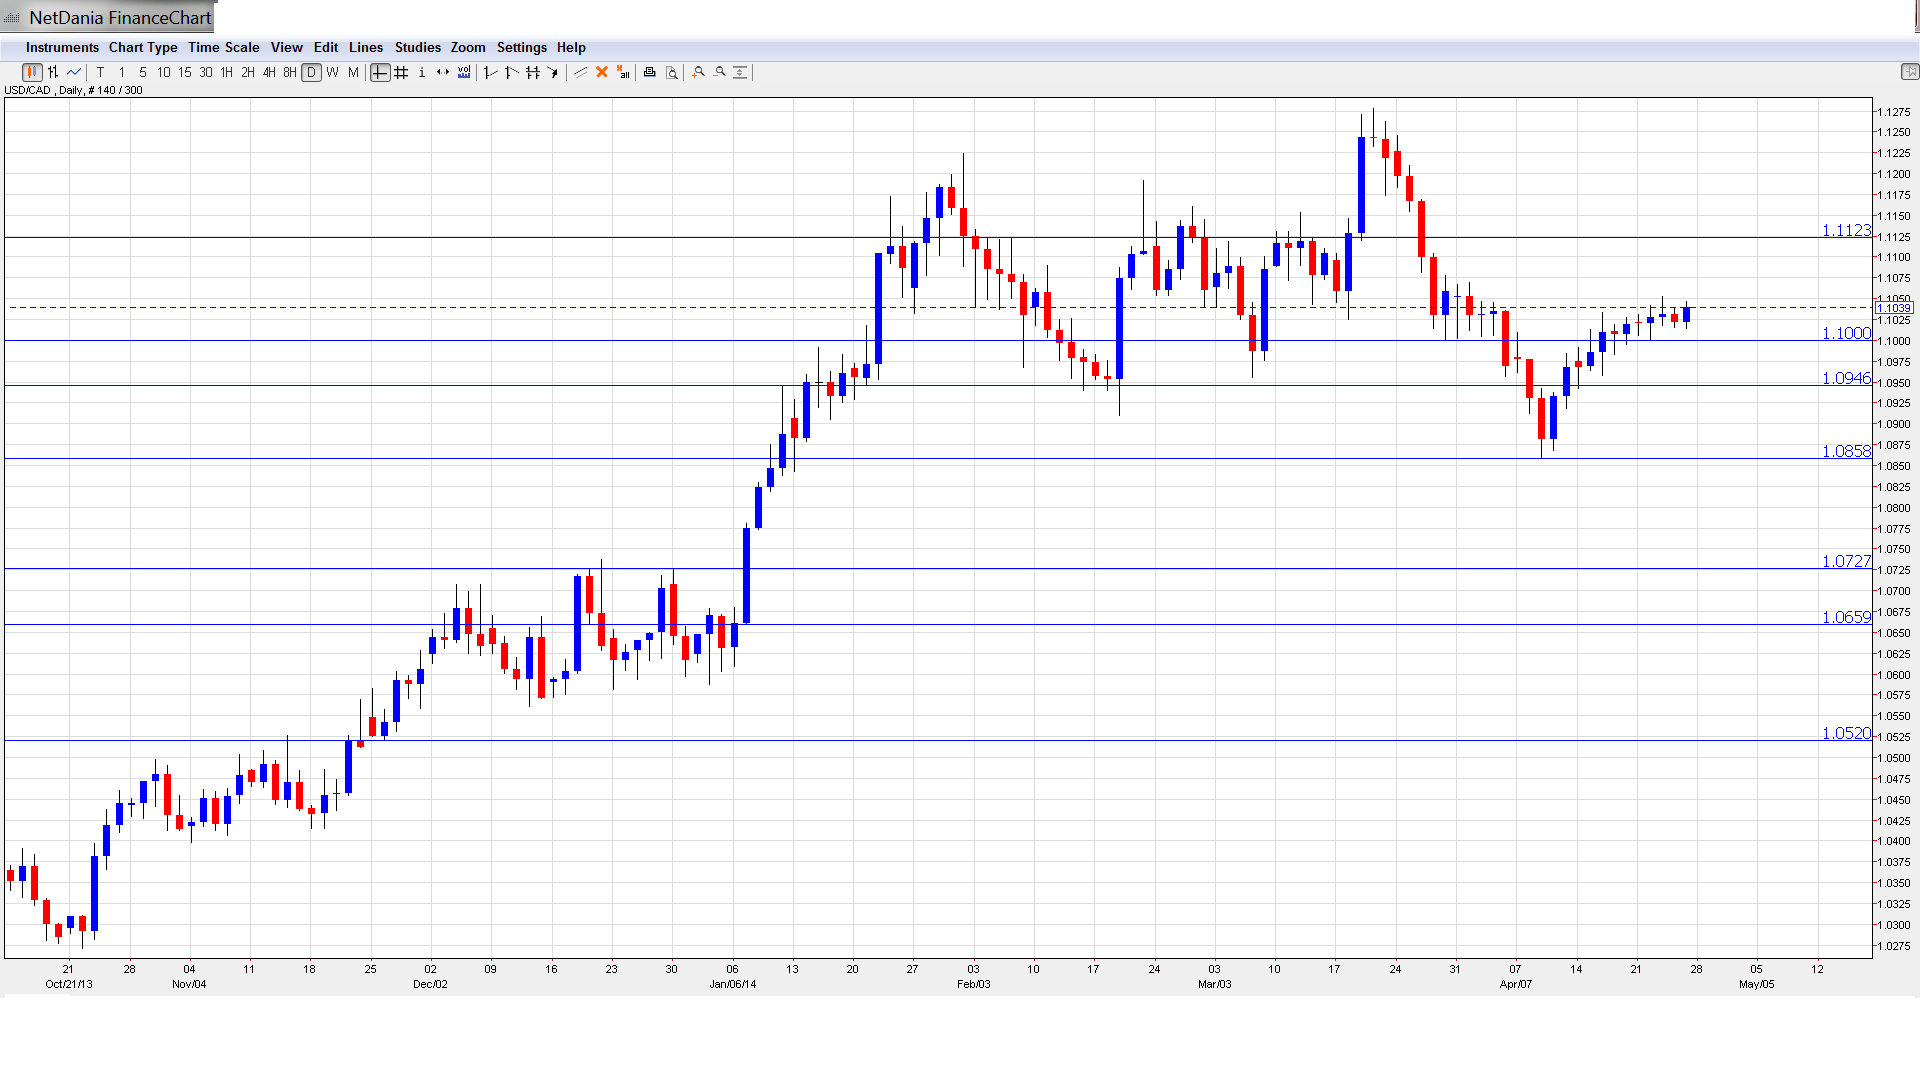
- BOC Governor Stephen Poloz Speaks: Tuesday, 19:30. Poloz will testify before the House of Commons Finance Committee in Ottawa. Remarks which are more hawkish than expected is bullish for the Canadian dollar.
- GDP: Wednesday, 12:30. This is the key event of the week. Unlike most other countries, Canada releases GDP on a monthly rather than quarterly basis. The indicator bounced back last month with a respectable gain of 0.5%, edging above the estimate of 0.4%. This was the indicator’s best showing since August. The markets are anticipating a weaker reading for March, with an estimate of 0.2%.
- RMPI: Wednesday, 12:30. Raw Materials Price Index measures inflation in the manufacturing sector. The index has shown impressive gains so far in 2014, surging 5.7% in March. This easily surpassed the estimate of 2.3%. The estimate for the upcoming release stands at just 1.2%. Will the index again surprise the markets and beat the prediction?
*All times are GMT.
USD/CAD Technical Analysis
USD/CAD opened the week at 1.1021 and dropped to the key 1.10 line (discussed last week), before reversing direction and moving higher. USD/CAD closed the week at 1.1039.
Live chart of USD/CAD: [do action=”tradingviews” pair=”USDCAD” interval=”60″/]
Technical lines, from top to bottom:
We begin with resistance at 1.1617, which marked a high point for the pair in July 2009, when the Canadian dollar posted a rally in which USD/CAD dipped below the 0.94 line.
1.1535 provided key support back in early 2007. It has been a resistance line since July 2009.
1.1369 fell in October 2008 as the US dollar posted sharp gains, climbing as high as the 1.21 level.
1.1124 remains a strong resistance line. It has held firm since late March.
USD/CAD has spent much of April close to the psychological barrier of 1.10. This level was breached again last week, but remains in place as a support level. It is a weak line and could see more action early this week.
1.0945 is the next line of support for the pair. It held steady as the pair was unable to break into 1.10 territory.
1.0853 is a strong support line. It has remained intact since January.
1.0723 was a cap in mid-2010, before the US dollar tumbled and dropped all the way into 0.93 territory.
1.0660 saw a lot of activity in the second half of December and continues to provide strong support.
1.0519 is the final support level for now. It has been a strong support line since late November.
I am bullish on USD/CAD
The 1.10 line has proven to be a strong support line as USD/CAD was unable to break below this level last week. US releases have general been positive, and the Fed will likely enact another QE taper next week, which is a dollar-positive event.
Further reading:
- For a broad view of all the week’s major events worldwide, read the USD outlook.
- For EUR/USD, check out the Euro to Dollar forecast.
- For the Japanese yen, read the USD/JPY forecast.
- For GBP/USD (cable), look into the British Pound forecast.
- For the Australian dollar (Aussie), check out the AUD to USD forecast.
- USD/CAD (loonie), check out the Canadian dollar.
