USD/JPY got comfortable in the old range. Can it make another break? Trade balance and the meeting minutes from the BOJ are the main events. Here is an outlook on the major events moving the yen and an updated technical analysis for USD/JPY.
Japan grew more than earlier reported. With a strong growth rate of 1.6%, it seems less likely that the BOJ will need to act. Nevertheless, the central bank would certainly prefer a weaker yen and made sure that this happens with its open door message in the rate decision. In the US, the ship continues to move nicely forward, and the higher US yields also support the pair.
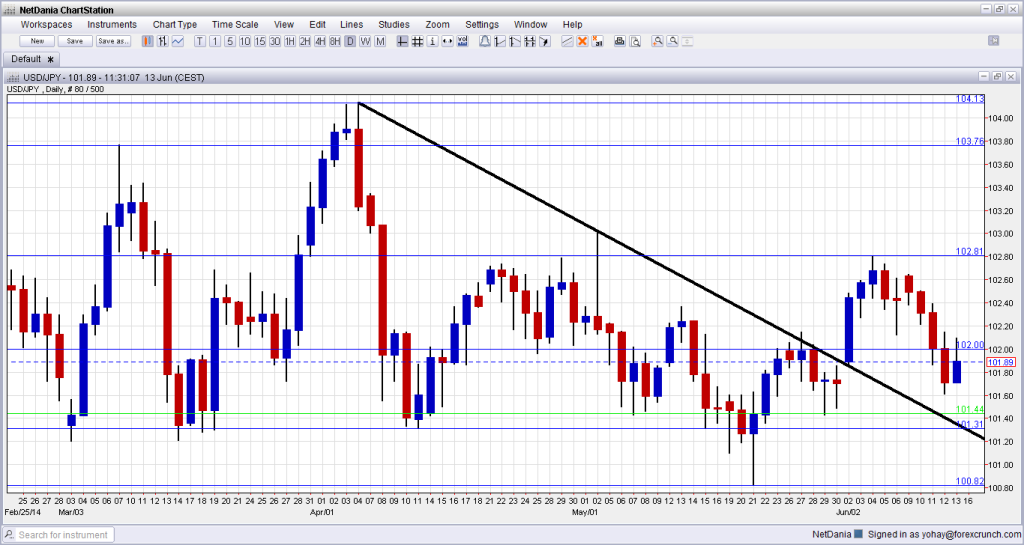
[do action=”autoupdate” tag=”USDJPYUpdate”/]USD/JPY graph with support and resistance lines on it. Click to enlarge:
- BOJ Monthly Report: Monday, 5:00. This monthly assessment of the economy, inflation and growth sometimes contains hints to the next moves by the BOJ. A cautious report is likely.
- Trade balance: Tuesday, 23:50. The cost of importing more energy after shutting down nuclear reactors has tipped the trade balance (but for a change not the current account) to negative. After a deficit of 0.84 trillion yen in April, a wider deficit is likely in May: 1.01 trillion yen.
- Meeting Minutes: Tuesday, 23:50. While these are not meeting minutes from the very latest BOJ decision, the look into the discussions of the central bank certainly provide insights as the highly anticipated July decision approaches.
- All Industries Activity: Thursday, 4:30. This official government figure showed a rise of 1.5% in activity during the month of March, just before the sales tax hike. For April, a sharp fall of 3.7% is expected in the activity of all industries. Note that a large part of the data making this report has already been released, thus softening the impact.
* All times are GMT
USD/JPY Technical Analysis
Dollar/yen began the week with a slide with the 102-102.74 range (mentioned last week). It did slip below this line, but never got too far.
Live chart of USD/JPY: [do action=”tradingviews” pair=”USDJPY” interval=”60″/]
Technical lines from top to bottom
The top line is the peak seen in the turn of the year: 105.44. This was challenged several times. Below, 104.80 capped the pair during January.
104.10, the high of April 2014 is currently a minor line, but should be watched. Below, 103.77 provided support for the pair in January and served as a clear separator of ranges.
102.80 was a stubborn peak during February and is the top line of the current trading range. 102.00 is a round number that supported the pair several times and is the botom of the range.
101.30 provided strong support for the pair during May 2014 and is the low line of support. 100.75 prevented the pair from falling lower during February and is the last backstop before the round number of 100.
100 is not just a round number but also worked as resistance several times in the past.
Broken downtrend resistance
Since peaking above 104 in early April, the pair was capped by downtrend resistance, clearly formed in early May and now left behind, despite the recent falls.
I remain bullish on USD/JPY
The BOJ does not really want to tune up to the recent data but prefers to keep the pedal to the floor, keeping a low value of the yen and supporting the economy. Rising US yields and a growing notion that the US economy is doing well support the pair as well. And while the BOJ refrained from rocking the boat, the Fed could certainly upgrade its message, going along the lines of the BOE.
Further reading:
- For a broad view of all the week’s major events worldwide, read the USD outlook.
- For EUR/USD, check out the Euro to Dollar forecast.
- For GBP/USD (cable), look into the British Pound forecast.
- For the Australian dollar (Aussie), check out the AUD to USD forecast.
- For USD/CAD (loonie), check out the Canadian dollar forecast.
- For the kiwi, see the NZDUSD forecast.
