The New Zealand dollar was not able to enjoy the drop in unemployment as the underlying currents did not play in its favor. What’s next for the kiwi? Retail sales is the main event this week. Here is an analysis of fundamentals and an updated technical analysis for NZD/USD.
While New Zealand’s unemployment rate dropped to a post crisis low of 5.6%, it was only due to a drop in the participation rate. The employment change figure wasn’t that great: a rise of 0.4% in employment. The US dollar continued advancing against many currencies, thanks to more positive data, and this also hurt the kiwi. Nevertheless, the pair managed to escape the lows and eventually recover.
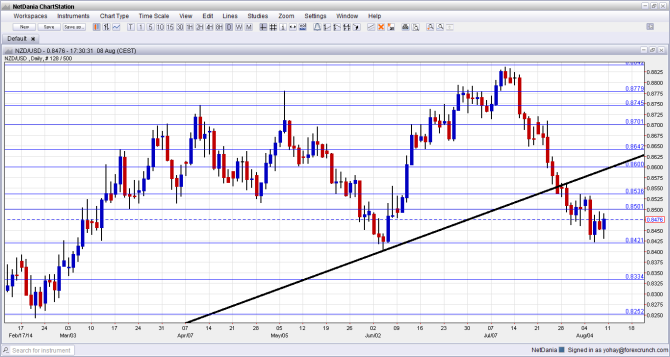
[do action=”autoupdate” tag=”NZDUSDUpdate”/]NZD/USD daily chart with support and resistance lines on it. Click to enlarge:
- REINZ HPI: Publication time unknown at the moment. This gauge of house prices has dropped in the past two months, showing a drop of 0.3% in June. A rebound is expected for the month of July, but this isn’t expected to be a big one.
- Business NZ Manufacturing Index: Wednesday, 22:30. The growth rate of New Zealand manufacturing has slowed down according to Business NZ. The PMI-like indicator stood on 53.3 points in June, better than in May but far from the highs seen earlier in the year. Another erosion is probable now.
- Retail Sales: Wednesday, 22:45. Like many other important figures, New Zealand publishes the retail sales data only once per quarter, making the release even more significant for the market. After total sales advanced 0.7% in Q1 2014, a stronger growth rate is likely for the second quarter: 1%. Core sales, which excluding automobiles and gas station expenditures rose by 0.8% in Q1, and here we also expect a more robust growth rate in Q2: 1.1%.
* All times are GMT.
NZD/USD Technical Analysis
Kiwi/dollar started off the week with a quick attempt to move higher, but it quickly fell back down and reached the lows at 0.8420, a new level that joins our chart and didn’t appear last week. From we have seen a recovery but the pair failed to reconquer 0.85.
Live chart of NZD/USD:
[do action=”tradingviews” pair=”NZDUSD” interval=”60″/]Technical lines, from top to bottom:
The May peak of 0.8780 is a very important line: the kiwi hesitated towards this line in June. The previous 2014 peak of 0.8745 is now weaker resistance after being broken.
The round number of 0.87 proved its strength during May and is now a pivotal line. The older swing high of 0.8640 worked as a pivotal line but eventually capped the pair.
It is followed by the round number of 0.86, which worked as a cushion during May 2014. The 0.8535 capped the pair in early August 2014 and serves as minor resistance.
The round number of 0.85 returns to the chart and now defines the top of the range. 0.8420 is the low seen in August 2014 and significant support at the bottom of the same range.
It is followed by 0.8335. The last line for now is 0.8250, which provided some support back in February.
Further below, the round levels of 0.82 and 0.81 provide support.
Long term uptrend line broken
The trend line mentioned in recent weekly reports has been broken to the downside.
I am bearish on NZD/USD
While the pair escaped the lows, the quarterly unemployment is certainly unconvincing and could weigh on the pair for longer. With the influx of geopolitical issues, we could see further strengthening of the safe haven currencies (the dollar and the yen) and this could also be negative.
More kiwi: NZDUSD Remains At Risk Of Further Declines
Further reading:
- For a broad view of all the week’s major events worldwide, read the USD outlook.
- For EUR/USD, check out the Euro to Dollar forecast.
- For the Japanese yen, read the USD/JPY forecast.
- For GBP/USD (cable), look into the British Pound forecast.
- For the Australian dollar (Aussie), check out the AUD to USD forecast.
- For USD/CAD (loonie), check out the Canadian dollar forecast.
