The New Zealand dollar was unable to withstand the strength of the mighty greenback, despite positive data at home. Can AUD/NZD hit parity? Here is an analysis of fundamentals and an updated technical analysis for NZD/USD.
At first, the kiwi enjoyed some positive news and continue advancing: terms of trade dropped less than expected and the price of milk rose by 1.1%. However, when the excellent NFP was published in the US, the New Zealand dollar just caved in and lost ground.
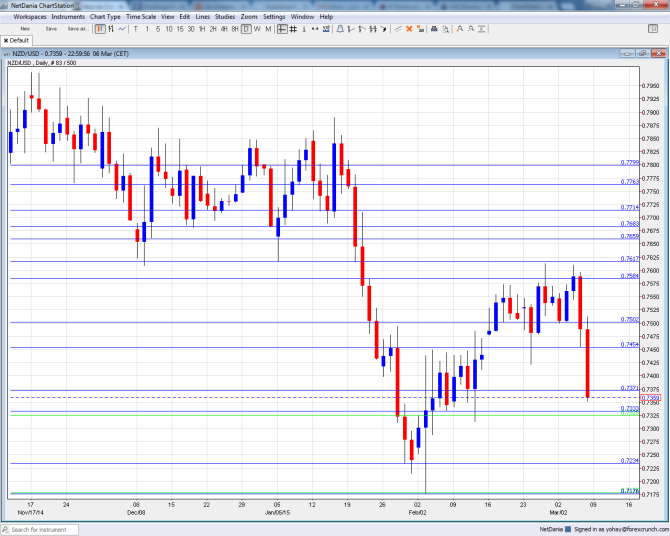
[do action=”autoupdate” tag=”NZDUSDUpdate”/]NZD/USD daily chart with support and resistance lines on it. Click to enlarge:
- Manufacturing Sales: Sunday, 21:45. The quarterly level of sales dropped for a second consecutive quarter in Q3, by 1.2%. A bounce is expected for Q4. Despite the lagging publication, this figure’s timing, on thin liquidity, makes it somewhat more important.
- Rate decision: Wednesday, 20:00. The RBNZ left the interest rate unchanged at 3.50% in its last meeting, extending the pause. The difference was in the language, that removed the hawkish bias and even opened the door to rate cuts. No change is expected now, but this doesn’t mean a lack of excitement. Every word will be scrutinized. While the situation in New Zealand looks good, the central bank would certainly like to see a weaker exchange rate. Will Wheeler keep the door open for rate cuts? He probably will. The event is accompanied by a press conference by Governor Wheeler, which begins 5 minutes after the rate statement is released.
- FPI: Wednesday, 21:45. The Food Price Index is important due to New Zealand’s food exports. After a rise of 1.3% in January, a more modest rise is on the cards now.
- Business NZ Manufacturing Index: Thursday, 21:30. This indicator for the manufacturing sector dropped from 57.1 to 50.9 points in January. A small rise is likely for March.
* All times are GMT.
NZD/USD Technical Analysis
Kiwi/dollar started the week with another upwards move and eventually reached the 0.7615 line (mentioned last week). However, its fate changed rapidly and the pair crashed and closed at 0.7359.
Live chart of NZD/USD:
[do action=”tradingviews” pair=”NZDUSD” interval=”60″/]Technical lines, from top to bottom:
0.7715 was stronger support after serving holding the pair in December. 0.7680 worked as support in December and that is where the pair stopped in early January 2015.
Below this point, we are back to levels last seen in 2012: 0.7615 now works as resistance after providing support during January 2015. It is followed closely by 0.7585 which capped the pair on an initial recovery attempt.
The very round number of 0.75 capped the pair just before the big fall and serves as strong resistance. It is followed by 0.7450 that had a role in the past.
The next line is 0.7370, which was a low point in 2011. It is followed by 0.7325, which capped the pair in the middle of 2010.
The recent 2015 low of 0.7235 is now the next support line. It is followed by 0.7180 that served as resistance back in 2010.
The swing low of 0.71 in 2011 provides further support before the very round number of 0.70.
Below this round number, we have 0.6950 and 0.6810.
I am bullish on NZD/USD
The New Zealand economy is doing well, and its main export, milk, is on the rise. These factors support a recovery of the pair. The fall in NZD is unjustified: it was carried away too far by the USD surge. The pair has the best prospects to recover.
In the fresh podcast, we talk about the US economy, the Australian and Canadian rate decisions, a potential easing in Japan, the widening gap within oil prices and an update on forex brokers after the SNBomb
Further reading:
- For a broad view of all the week’s major events worldwide, read the USD outlook.
- For EUR/USD, check out the Euro to Dollar forecast.
- For the Japanese yen, read the USD/JPY forecast.
- For GBP/USD (cable), look into the British Pound forecast.
- For the Australian dollar (Aussie), check out the AUD to USD forecast.
- For USD/CAD (loonie), check out the Canadian dollar forecast.
