The British pound bounced back in spectacular style last week, as GBP/USD gained over 300 points. The pair closed at 1.4946. This week’s highlight is Retail Sales. Here is an outlook on the major events moving the pound and an updated technical analysis for GBP/USD.
The US dollar took it on the chin last week, as the markets reacted to disappointing US economic reports, including retail sales and housing data. There was better news late in the week as consumer confidence shot higher. The UK continues to struggle with weak inflation, as CPI remained at record low of 0.0% in March.
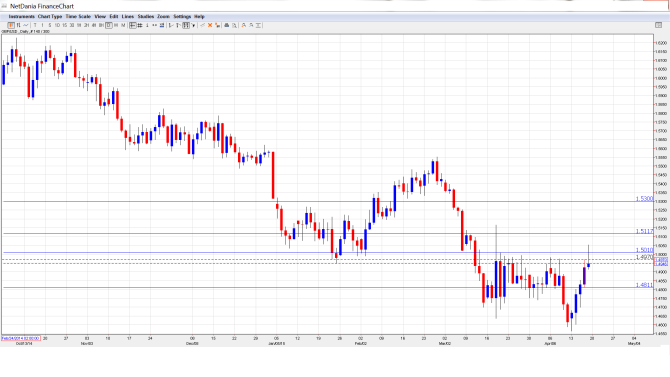
[do action=”autoupdate” tag=”GBPUSDUpdate”/]GBP/USD graph with support and resistance lines on it. Click to enlarge:
- Rightmove HPI: Sunday, 23:01. This indicator provides a snapshot of activity in the UK housing sector. In March, the indicator softened, with a gain of 1.0%.
- 30-year Bond Auction: Tuesday, Tentative. The yield on 30-year bonds has now softened over 7 straight readings, with the yield falling to 2.36% in February. Will the downturn continue in the upcoming release?
- MPC Official Bank Rate Votes: Wednesday, 8:30. The BOE held rates at 0.5% at its last policy meeting, and the markets expect that the decision was unanimous (9-0).
- MPC Asset Purchase Facility Votes: Wednesday, 8:30. Asset Purchase Facility remained at 375 billion pounds when the MPC met earlier in the month, and the votes have been unanimous since June 2013. No change is expected in the upcoming release.
- Retail Sales: Thursday, 8:30. Retail Sales is one of the most important economic indicators, and an unexpected reading can have an immediate effect on the movement of GBP/USD. In February, the indicator bounced back with a strong gain of 0.7%, above the forecast of 0.4%. The estimate for the March forecast stands at 0.4%.
- Public Sector Net Borrowing: Thursday, 8:30. The budget deficit swelled to GBP 6.2 billion in February, but this beat the estimate of GBP 7.7 billion. The markets are expecting the deficit to rise again in March, with an estimate of GBP 6.6 billion.
* All times are GMT
GBP/USD Technical Analysis
GBP/USD opened the week at 1.4636 and quickly dropped to a low of 1.4564. The pair then sharply reversed directions and climbed to a high of 1.5053, testing resistance at 1.5008 (discussed last week). The pair closed the week at 1.4946.
Live chart of GBP/USD:
[do action=”tradingviews” pair=”GBPUSD” interval=”60″/]
Technical lines from top to bottom
With the pound posting huge gains, we begin at higher levels:
1.5300 has provided resistance since the first week in March.
1.5114 has been a resistance line since mid-March.
1.5008 was tested as the pair briefly moved into 1.50 territory before retracting.
1.4813 was easily breached and has switched to a support role. It marked the start of a pound rally in July 2013 that saw GBP/USD climb above 1.61.
1.4621 has strengthened in support following the pound’s impressive rally. This line was an important cap in August 2001.
1.4521 is the final support level for now. It has remained intact since June 2010.
I am neutral on GBP/USD.
We continue to see significant volatility from GBP/USD in the month of April. Will the US dollar lick its wounds from last week and move higher? Despite some weak US numbers in recent weeks, analysts expect a strong spring, and market sentiment remains positive about the US economy. The UK economic picture is generally good, but uncertainty about the upcoming election could shake up the pair, and falling inflation remains a serious worry.
In our latest podcast, we talk about The Confetti Lady that moved Draghi but not Markets
Subscribe to Market Movers on iTunes
Further reading:
- For a broad view of all the week’s major events worldwide, read the USD outlook.
- For EUR/USD, check out the Euro to Dollar forecast.
- For the Japanese yen, read the USD/JPY forecast.
- For the kiwi, see the NZDUSD forecast.
- For the Australian dollar (Aussie), check out the AUD to USD forecast.
- USD/CAD (loonie), check out the Canadian dollar.
